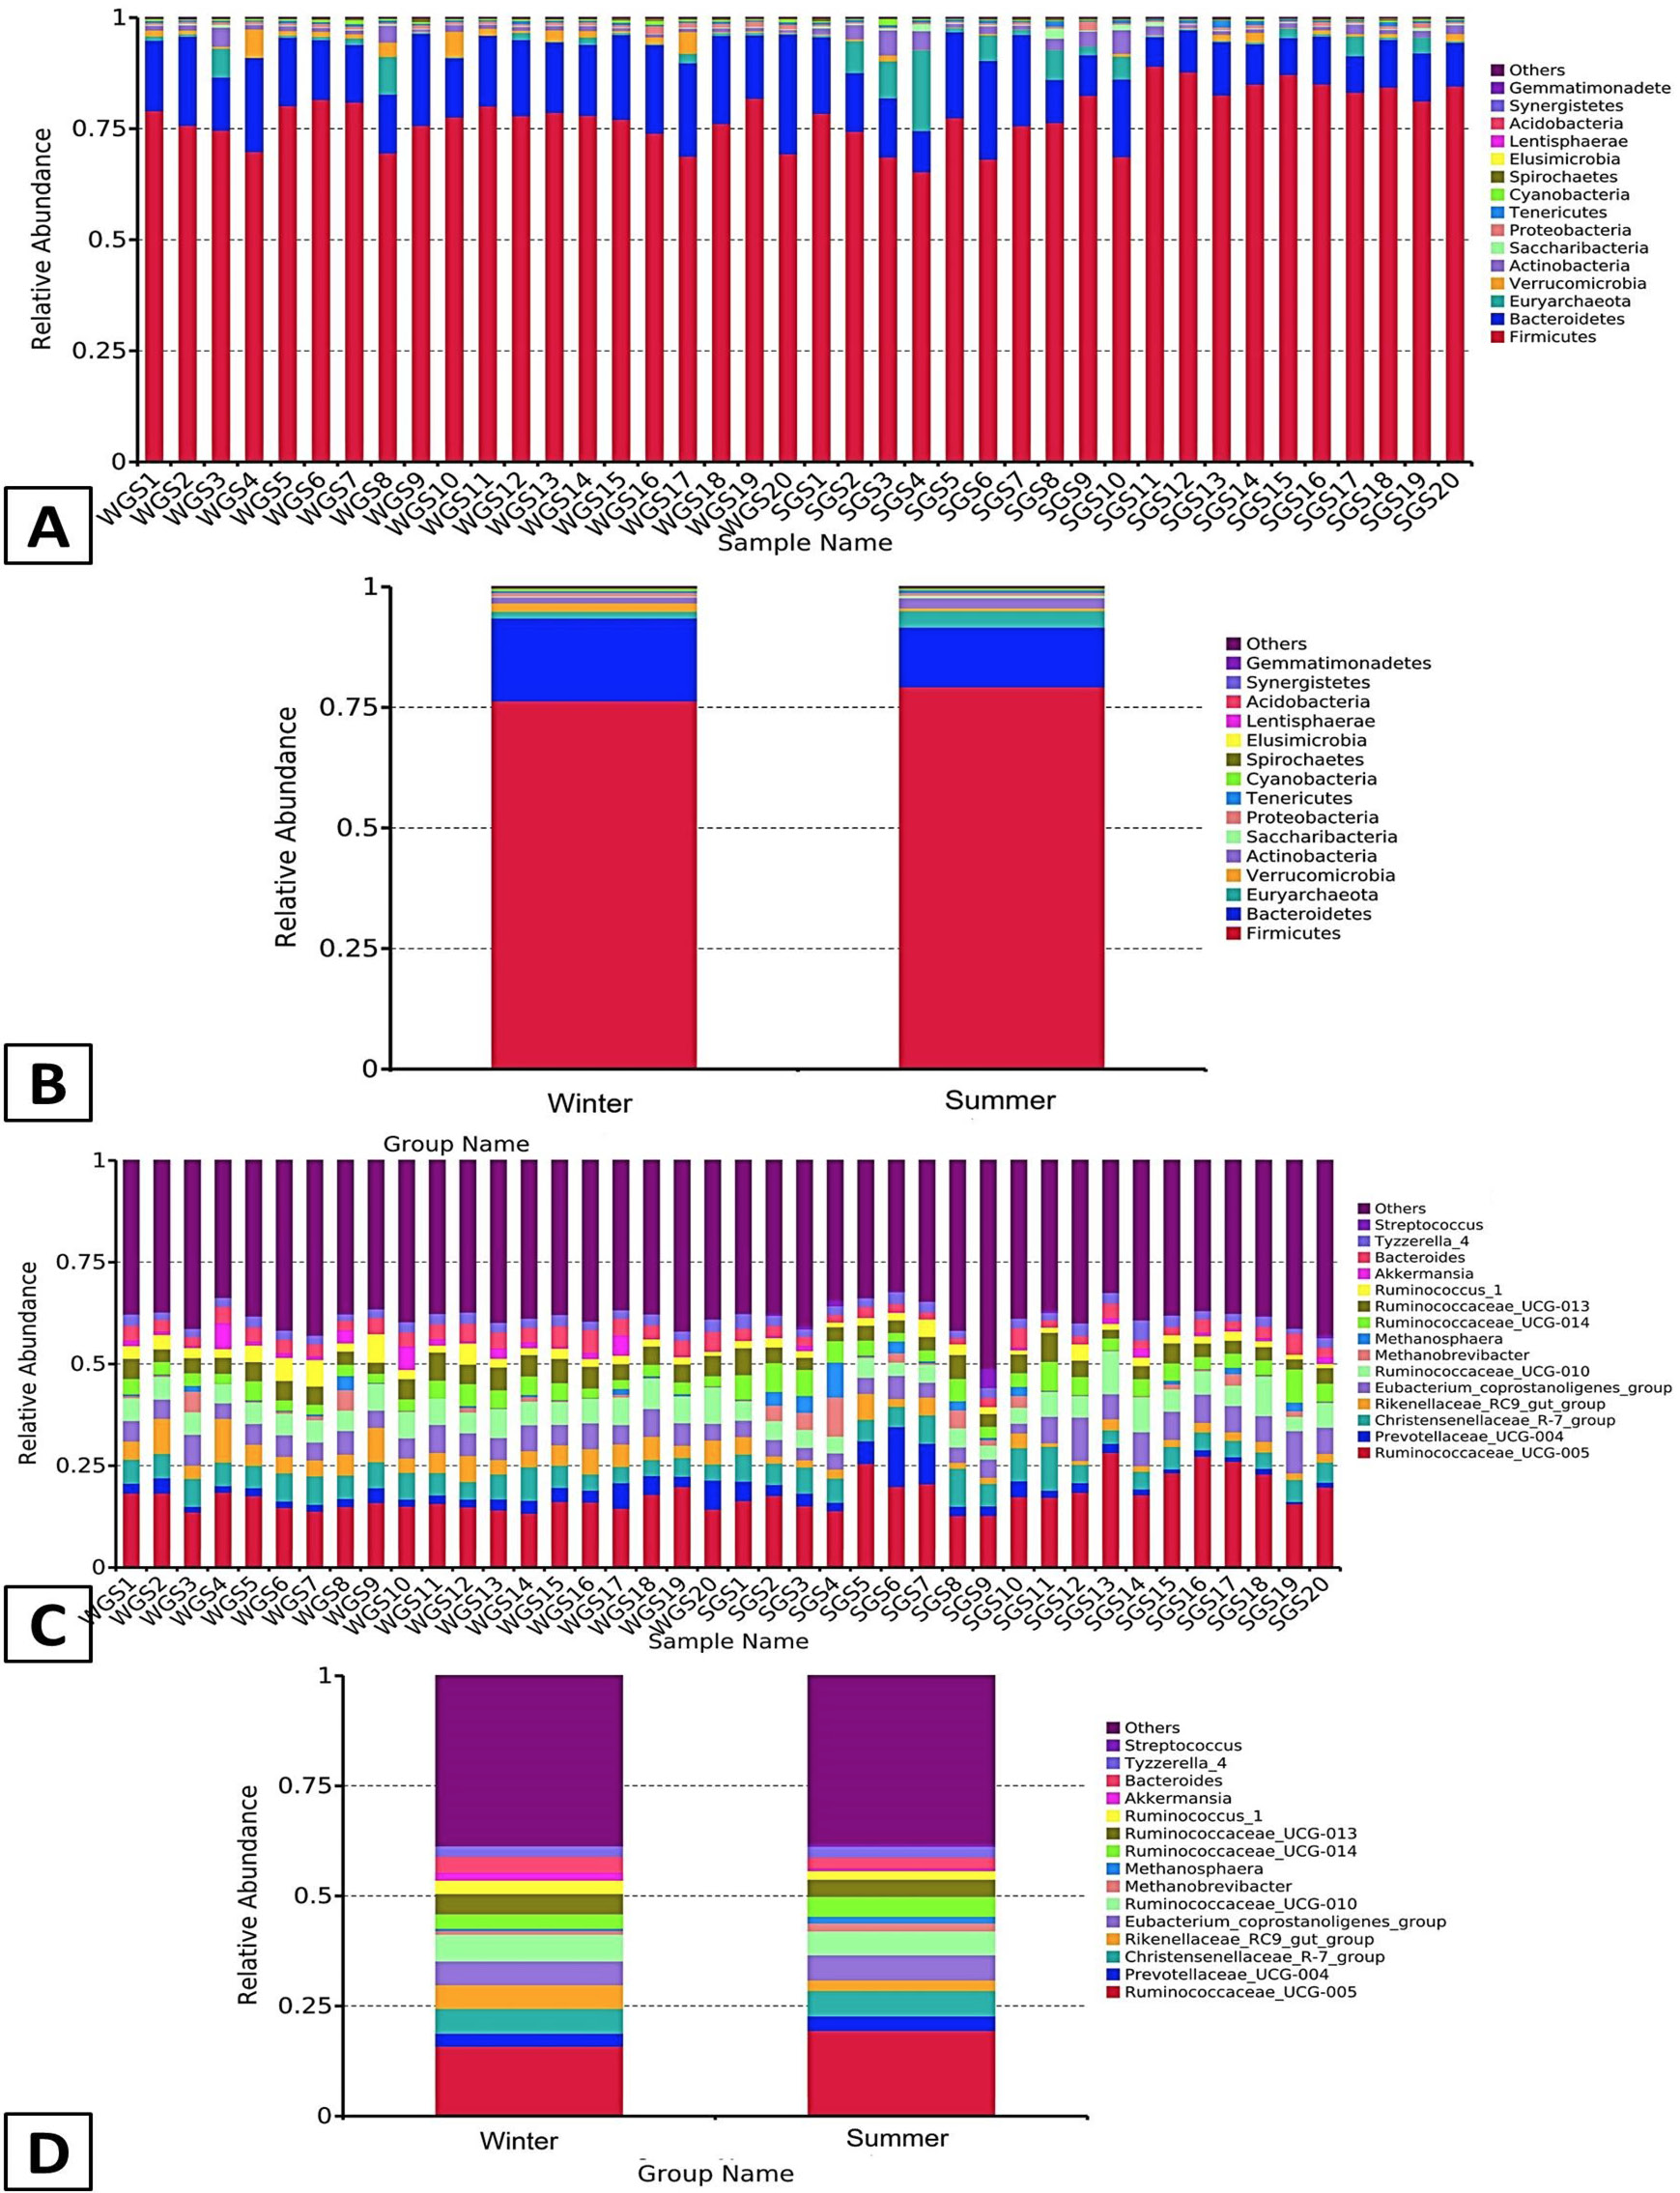
Fig. 1.
A, the relative abundance of the top 15 phyla in 40 samples; B, the relative abundance of the top 15 phyla in two groups, summer and winter; C, the relative abundance of the top 15 genera in 40 samples; D, the relative abundance of the top 15 genera in two groups, summer and winter.