
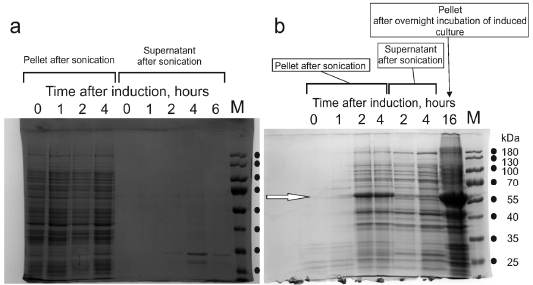
Figure 4
Results of experiments on the recombinant expression of boPAG1 (Panel a) and Trx-boPAG1 (Panel b). Samples of bacterial cultures were collected at time points indicated in the figures. Cell biomass was disrupted and separated into a soluble supernatant and insoluble precipitate. Protein contents in supernatants and precipitates were analyzed by SDS-PAGE. Photographs present stained SDS-PAGE gels. In Panel b, the white arrow points to the band of 56.2 kDa compatible with the Trx-boPAG1 protein. Lanes “M”, loaded with PageRuler Mw marker, 10-180 kDa (ThermoScientific 26616). The molecular masses of the marker bands are indicated.