View larger version:
Download Original File
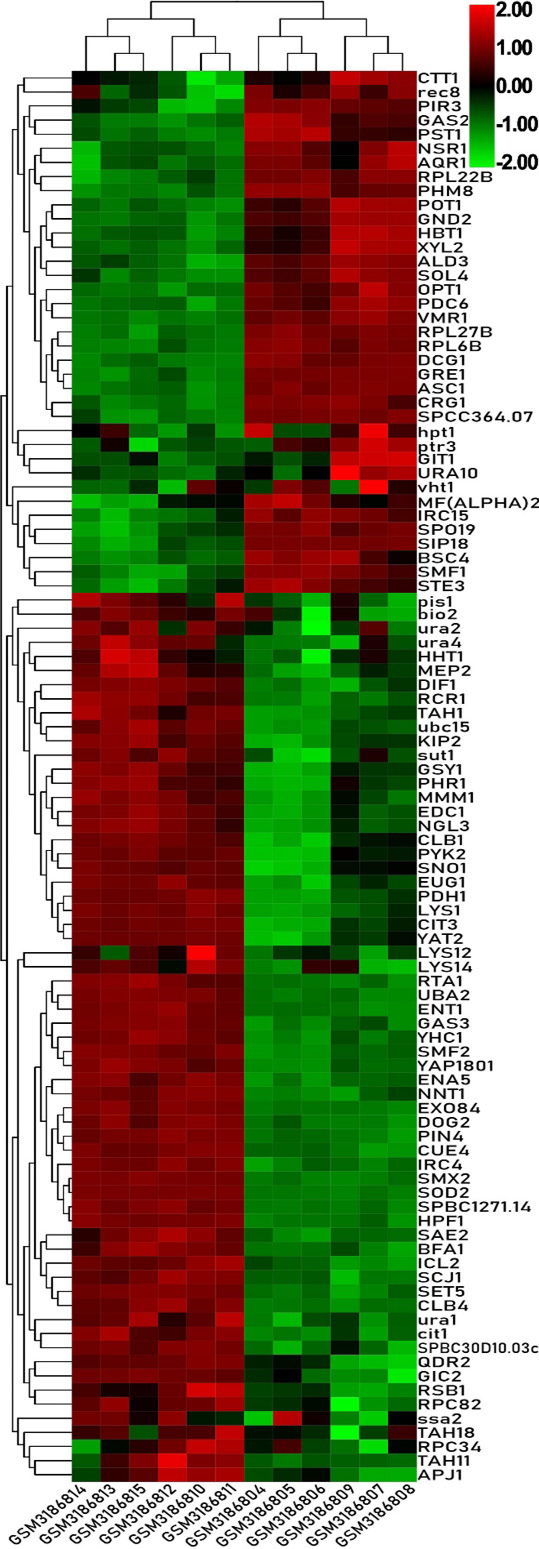
Fig. 2.
Heat map of the top 100 differentially expressed genes of GSE115660.
