
Figure 2:
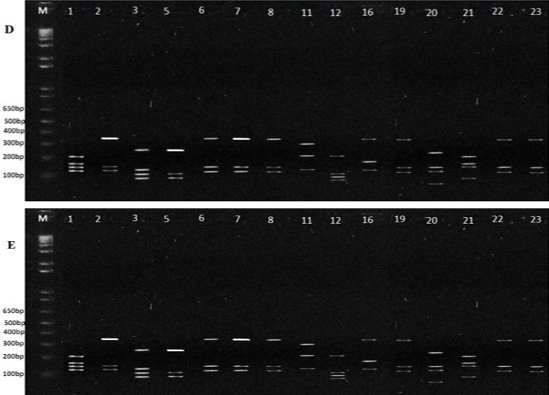
Agarose gel showing (A) amplification of ITS regions (ITS-1 and ITS-4) and restriction pattern of PCR-amplification product digested with HhaeI (B); BsuRI (C); HinfI (D) and MboI (E).
Agarose gel showing (A) amplification of ITS regions (ITS-1 and ITS-4) and restriction pattern of PCR-amplification product digested with HhaeI (B); BsuRI (C); HinfI (D) and MboI (E).