Figure 2
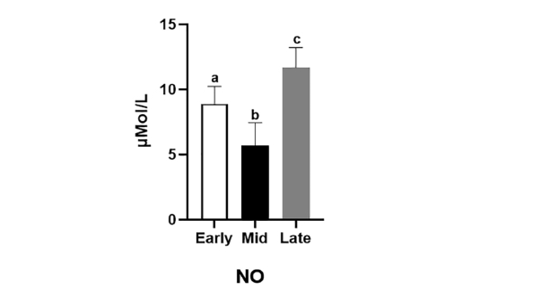
Concentrations of NO in CL homogenate during early, mid and late stages of CL. Bars are presented as mean±SEM. a,b,cStatistical differences between different stages of CL (statistical significant at P<0.001).
Concentrations of NO in CL homogenate during early, mid and late stages of CL. Bars are presented as mean±SEM. a,b,cStatistical differences between different stages of CL (statistical significant at P<0.001).