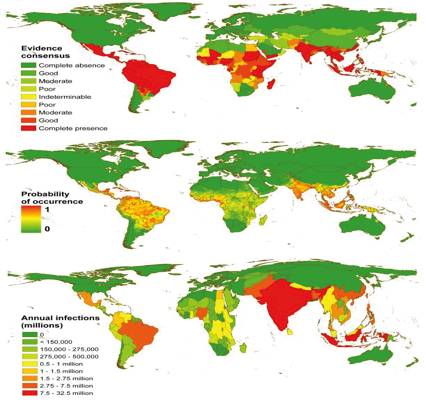
Figure 1
top, shows National and subnational evidence consensus on complete absence (green) through to complete presence (red) of dengue. middle, shows the probability of dengue occurrence at 5km × 5km spatial resolution of the mean predicted map (area under the receiver operator curve of 0.81 (±0.02 SD, n = 336)) from 336 boosted regression tree models. Areas with a high probability of dengue occurrence are shown in red and areas with a low probability in green. bottom, shows a cartogram of the annual number of infections for all ages as a proportion of national or sub-national (China) geographical area. Figures are reused with permission from (Brady et al. 2012, Bhatt et al. 2013).