View larger version:
Download Original File
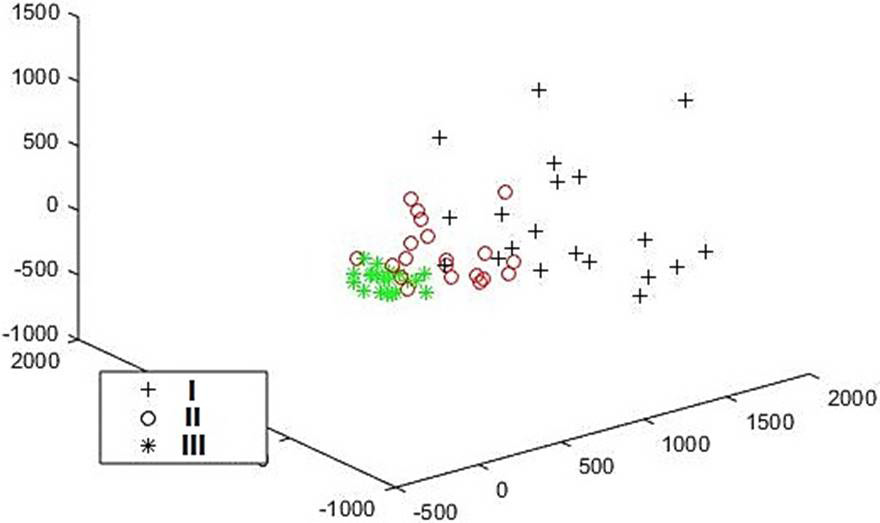
Fig. 5.
PCA 3D scatter plots of porcine parthenogenetic blastocysts with difference types of microoperarion.