
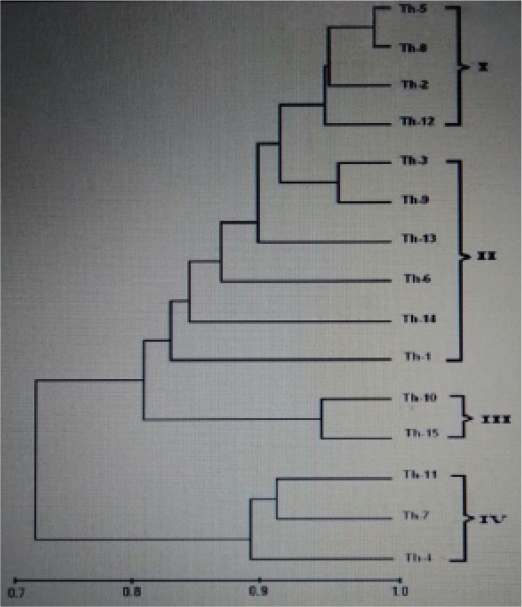
Figure 2
Dendrogram (with three RAPD primers) showing genetic similarities among 15 isolates of T. harzianum using the unweighted pair group method with arithmetical average (UPGMA) of Genetyx software, (version 7.0). RAPD clusters are indicated in the right.