
Fig. 1.
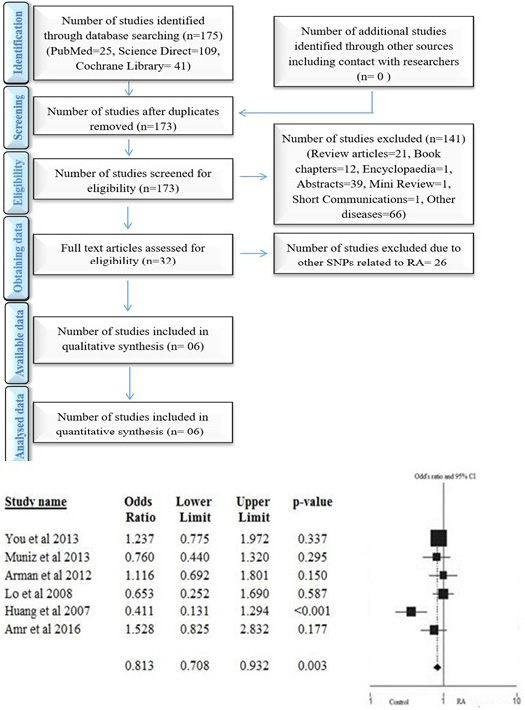
Schematic representation of the steps followed to search, screen and include the previous research in this study. Lower panel shows the odd’s ratio and p-values of the studies included in analysis.
Schematic representation of the steps followed to search, screen and include the previous research in this study. Lower panel shows the odd’s ratio and p-values of the studies included in analysis.