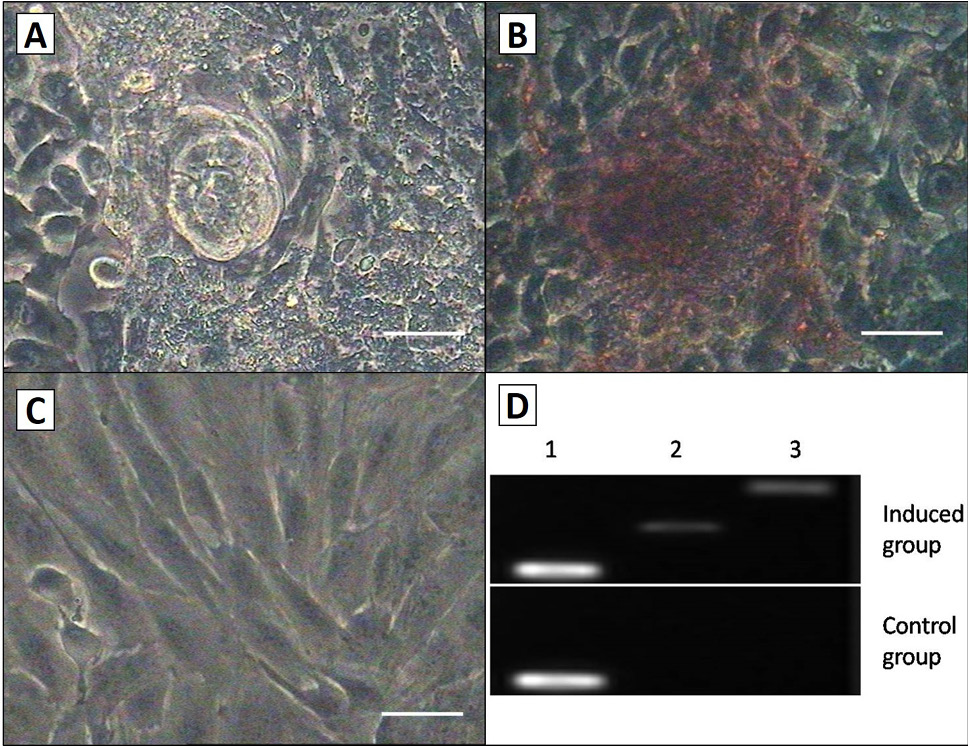
Fig. 7.
Osteogenic differentiation of the AMSCs. A, the quantity and size of nodules increased as induction progressed; B, after culturing in osteogenic medium for 3 weeks, cell shape in induced group was changed, and the group was positive by the way of alizarin red staining; C, There was no change in morphology or stained in control group. Scale bar, 50μm; D, RT-PCR detection of the osteogenic markers collage type I and osteopontin expression in the both groups. Induced cells were positive for osteopontin and collage type I, but the control cells were not. Lane 1, GAPDH; Lane 2, collage type I; Lane 3, osteopontin.