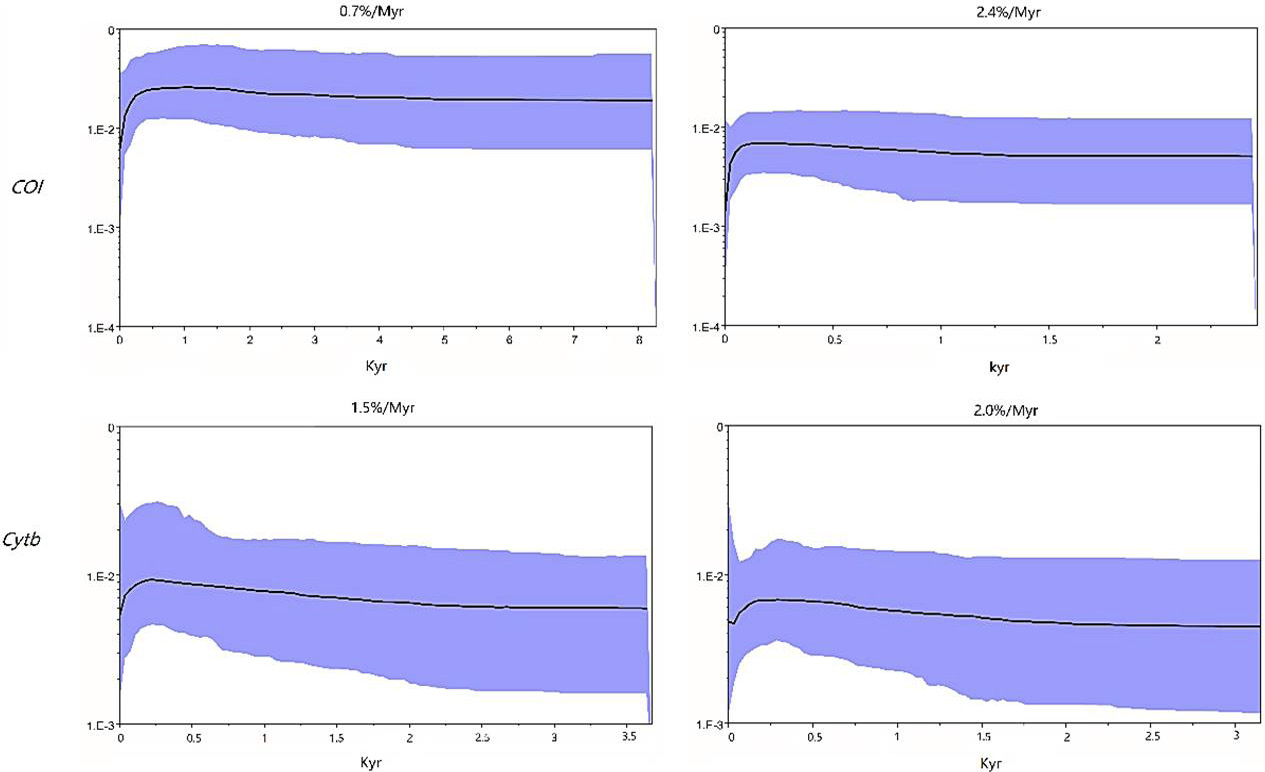
The Bayesian Skyline plot of seven samples using COI and Cytb genes in different rapid evolution rates.
