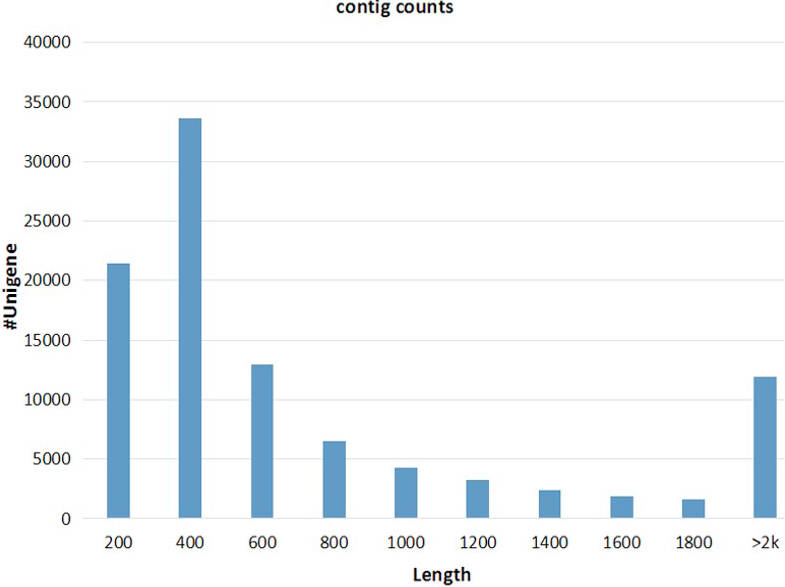
Fig 4
Frequency distribution of UniGene sequence lengths. Length interval of UniGenes on the horizontal axis, 400 representing length below 400; Counts of UniGenes at each length interval on the vertical axis, over 2000bp sorted as a category.