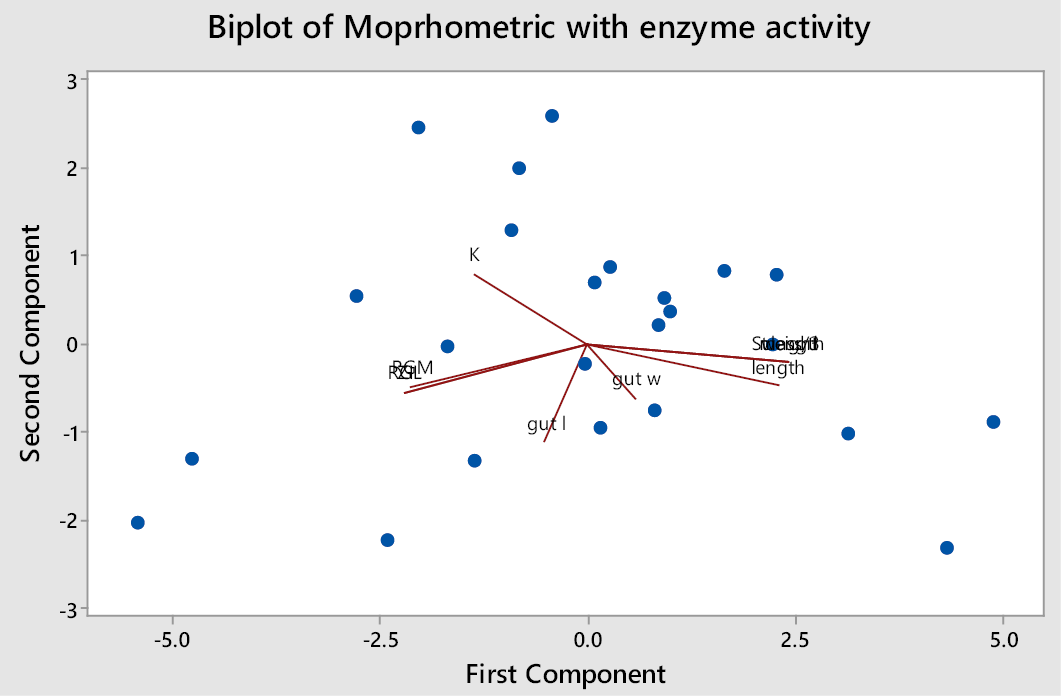
Figure 1:
Biplot of fish samples and generated through principal component analysis explained overall variation in the data with enzyme activity.
Biplot of fish samples and generated through principal component analysis explained overall variation in the data with enzyme activity.