
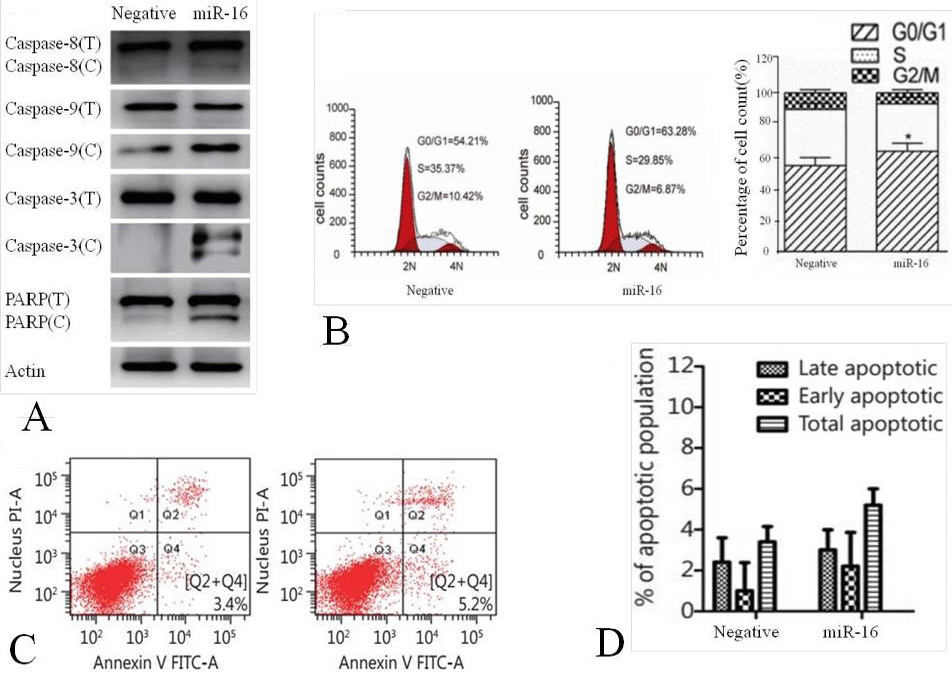
miR-16 increase apoptosis. (A) Lysates from PTC cells treated with miR-16 for 24 h were analyzed. Levels of cleaved caspase-8, caspase-9, caspase-3, and PARP were detected and compared with the total levels of each protein (labeled with C vs. T). Detection of Actin was performed as a loading control. (B) PTC cell cycle was analyzed by flow cytometer (PI staining) 48 h post transfection. In the group of miR-16, the proportion of cells at G0/G1 stage was much higher than negative groups (P<0.05). (C) Apoptosis was detected in the negative and miR-16 group of PTC cells by flow cytometry. (D) Quantification of the flow cytometry data according to apoptosis stage is shown with the error bars representing standard deviation values. P < 0.01, based on the Student’s t-test.