
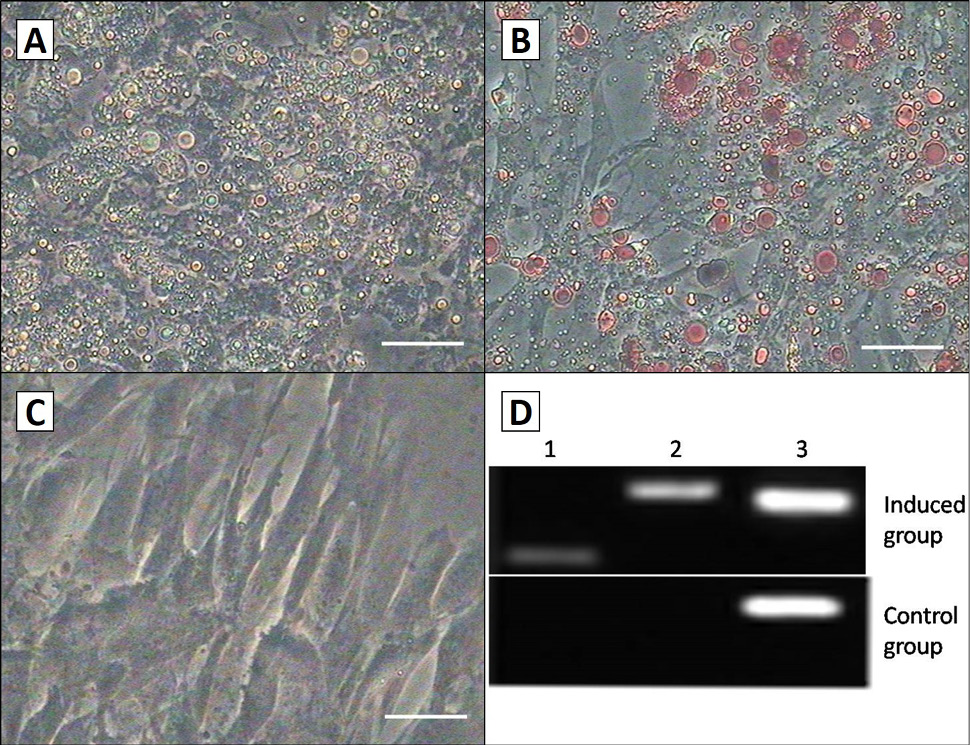
Fig. 6.
Adipogenic differentiation of the AMSCs. A, AMSCs were inducted after 1 week, they began to change from fibroblast-like to oblate, and there were a number of lipid droplets in petri dishes. Droplets increased and assembled to form larger ones along with the extension of induction time; B, they were positive for oil red O staining; C, the control group had no difference in the morphology and phenotype, and they were also negative for oil red O staining. Scale bar, 50 μm; D, RT-PCR detection of the adipogenic markers LPL and PPAR-γexpression in the both groups. They were positive in induced cells, but not in control cells. Lane 1, PPAR-γ; Lane 2, LPL; Lane 3, GAPDH.