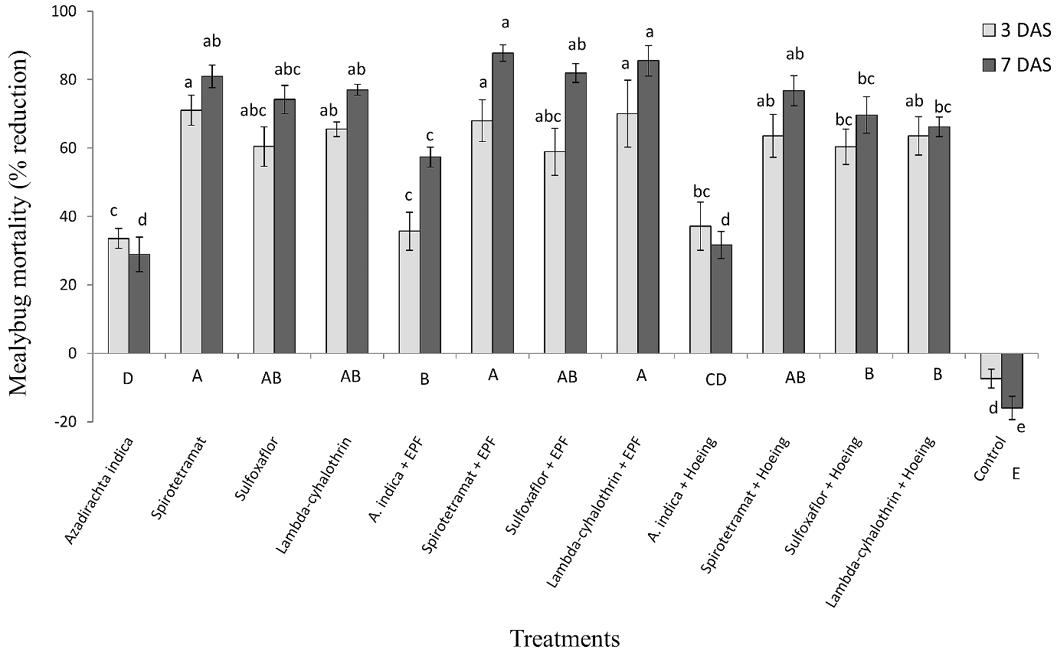
Figure 2
Percent reduction (mean ± SE) in the population of mealybug Drosicha mangiferae Green on plants of Citrus reticulata (mandarin orange) in response to different pest control treatments observed at 3 days (light-grey columns) and 7 days (dark-grey columns) post-treatment. Small and capital alphabets indicate respectively the significant difference among treatments for each observation time (one-way ANOVA; Tukey HSD test at α = 0.05) and the overall significance among treatments (factorial ANOVA; Tukey HSD test at α = 0.05).