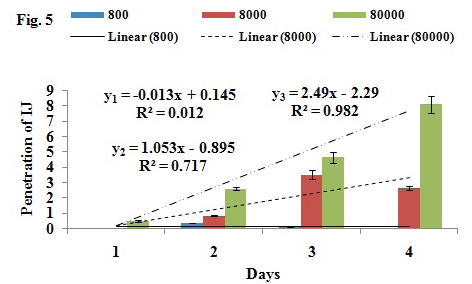
Figure 5
Effect of each inoculum dose on the penetration of infective juveniles of Steinernema feltiae into Galleria mellonella at each time interval (day). Bars are the standard errors of means. y1, y2 and y3 represent regression equations regarding penetration of infective juveniles of Steinernema feltiae into Galleria mellonella at 800, 8000 and 80000 IJ dose.