
Figure 2:
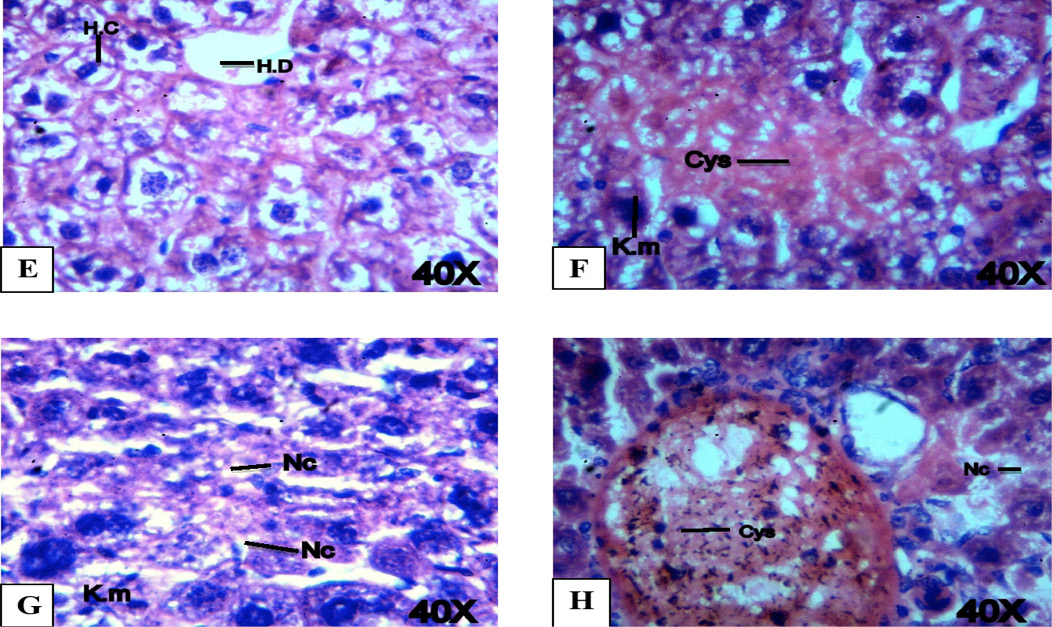
Histopathological examination of liver tissues of LFX exposed mice at 40X magnification. (A) Control mice showing normal structure i.e. HD: Hepatic duct; HC: Hepatocyte. (B) Mice treated with 9.37 μg/g B.W. of LFX showing Cys: cyst; K.m: karyomegaly. (C) Mice treated with 18.37 μg/g B.W. of LFX exhibiting Nc: necrosis; PN: pyknosis. (D) Mice treated with 37.50 μg/g B.W. of LFX showing Cys: cyst; Nc: necrosis’ H and E staining.