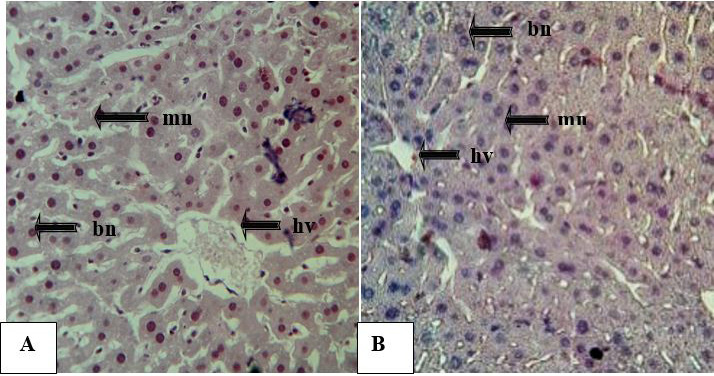
Figure 2:
Photomicrographs of liver sections of Cnt and ATZ treated groups, showing distribution, size and nuclear structure of the hepatocytes (HandE staining at 400×).Cnt (A) showed well-oriented mono (mn) and binuclear hepatocytes (bn) of similar size and regular shape, nuclei darkly stained with condensed chromatin. ATZ (B) treated sections revealed a decreased number of mono (mn) and binuclear (bn) hepatocytes of variable size, mostly of deformed shape. Normal liver showed compact hepatic vein (hv) while treated liver showed narrow irregular hepatic vein (hv). Sections of ATZ treated group also revealed vacuolization in the hepatocytes.