
Figure 4:
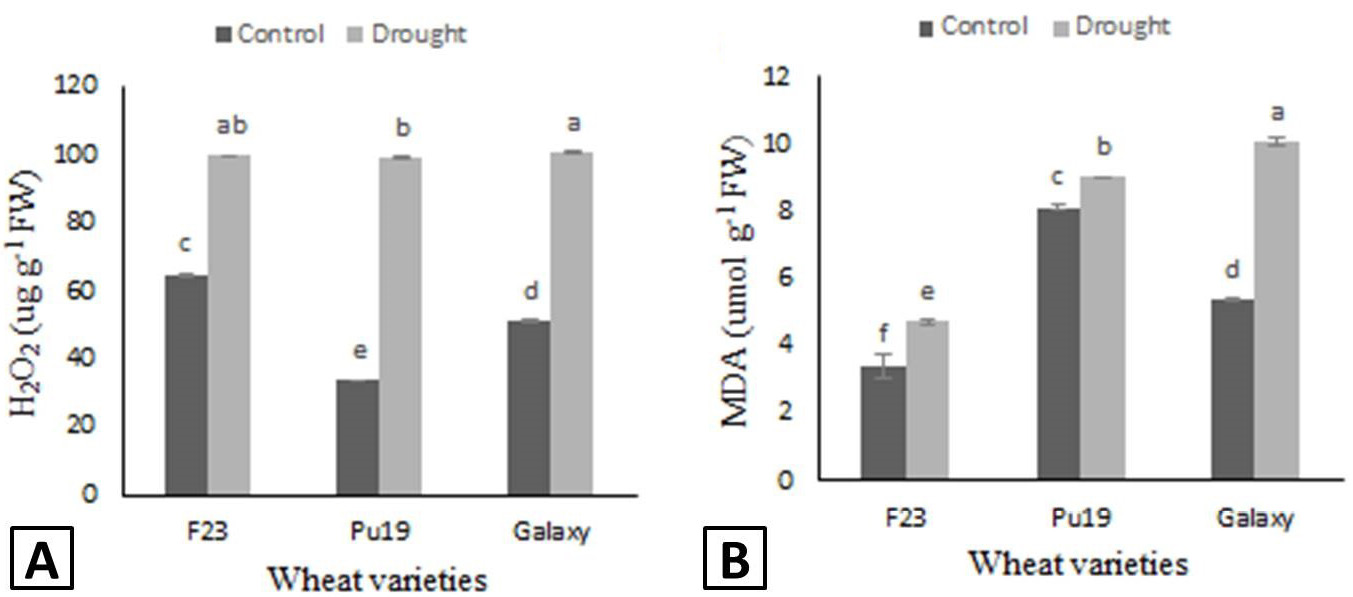
H2O2 contents of wheat leaves grown under control and drought condition. Different letters show the significant differences calculated by LSD at p<0.05. The data presented are mean values ± standard error of four replicates.
H2O2 contents of wheat leaves grown under control and drought condition. Different letters show the significant differences calculated by LSD at p<0.05. The data presented are mean values ± standard error of four replicates.