
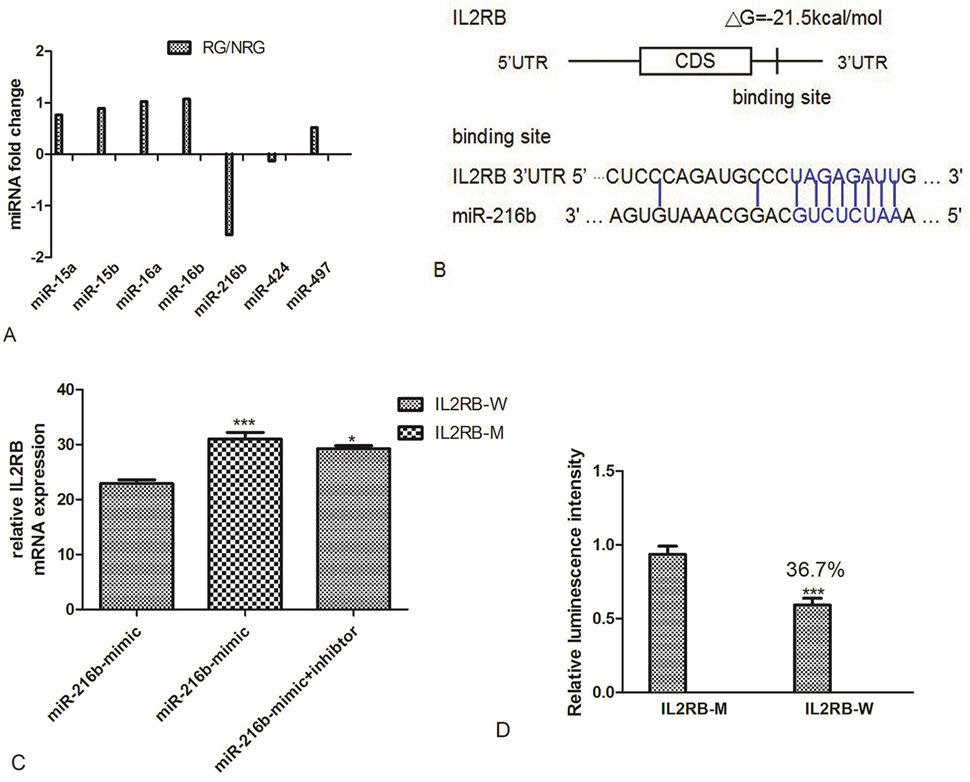
The IL2RB 3’-UTR contains conserved miR-216b target sites. A: The fold-changes of seven miRNAs predicted by three algorithms in RG intestinal tissues compared to NRG (control), as analysed by high-throughput sequencing. B: Schematic illustration of conserved duplexes formed by IL2RB 3’UTR and miR-216b interactions. The predicted free energy of the hybrid is noted. Paired bases are marked by a blue line. The complementary seed sites are marked in blue. C: Quantitative real-time PCR analysis of IL2RB expression in 293T cells transfected with miR-216b mimics, miR-216b inhibitor, IL2RB-W or IL2RB-M. Data are presented as the mean±SEM from three independent experiments (293T group: ***p=0.000092, IL2RB-M vs. IL2RB-W). D: Relative luminescence intensity detected by a Hamamatsu optical analyze reader after miR-216b mimics and dual-luciferase vectors were co-transfected into 293T cells (*** P<0.01).