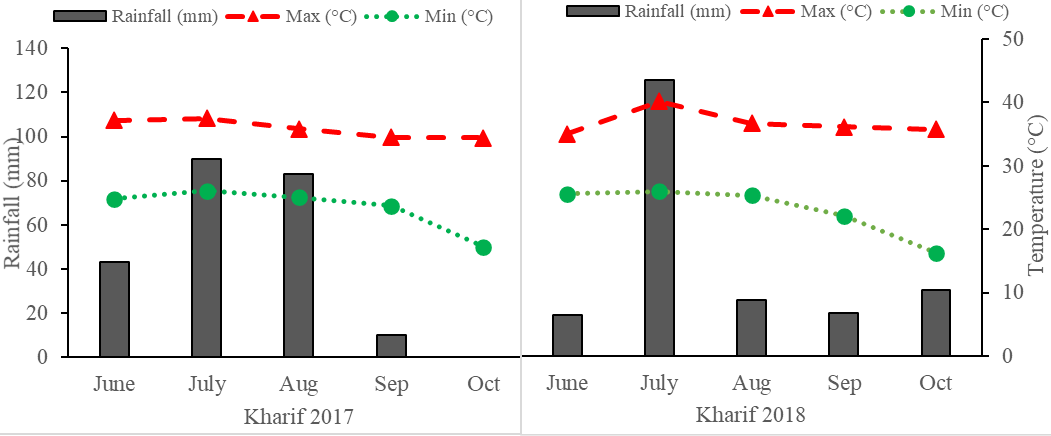
Rainfall (mm), temperature maximum (Max °C) and minimum (Min °C) of the study area during 2017 and 2018.