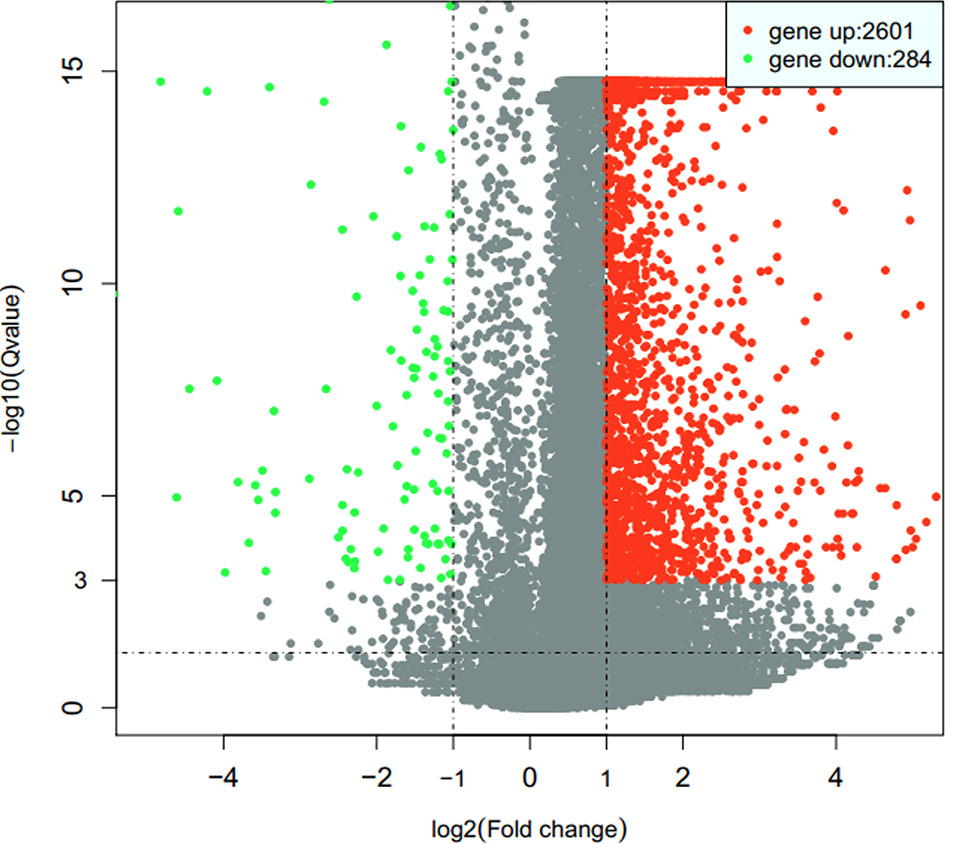
Fig. 1.
Volcano plot displaying of differentially expressed genes between Anqingliubai and Yorkshire pigs. The red points: the upregulated genes; The blue points: the downregulated genes; The gray points: the non-significant differentially genes.