Figure 5:
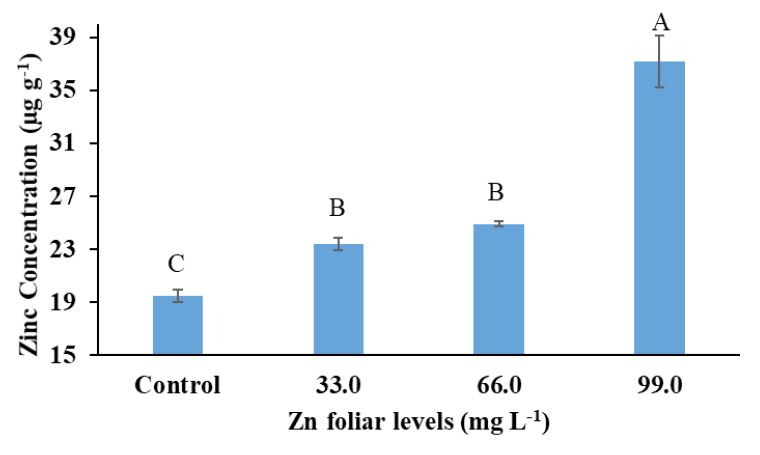
Effect of varying levels of Zn on Zn concentration (µg g-1) in strawberry fruits; each value is a mean ± SE (n = 4).
Effect of varying levels of Zn on Zn concentration (µg g-1) in strawberry fruits; each value is a mean ± SE (n = 4).