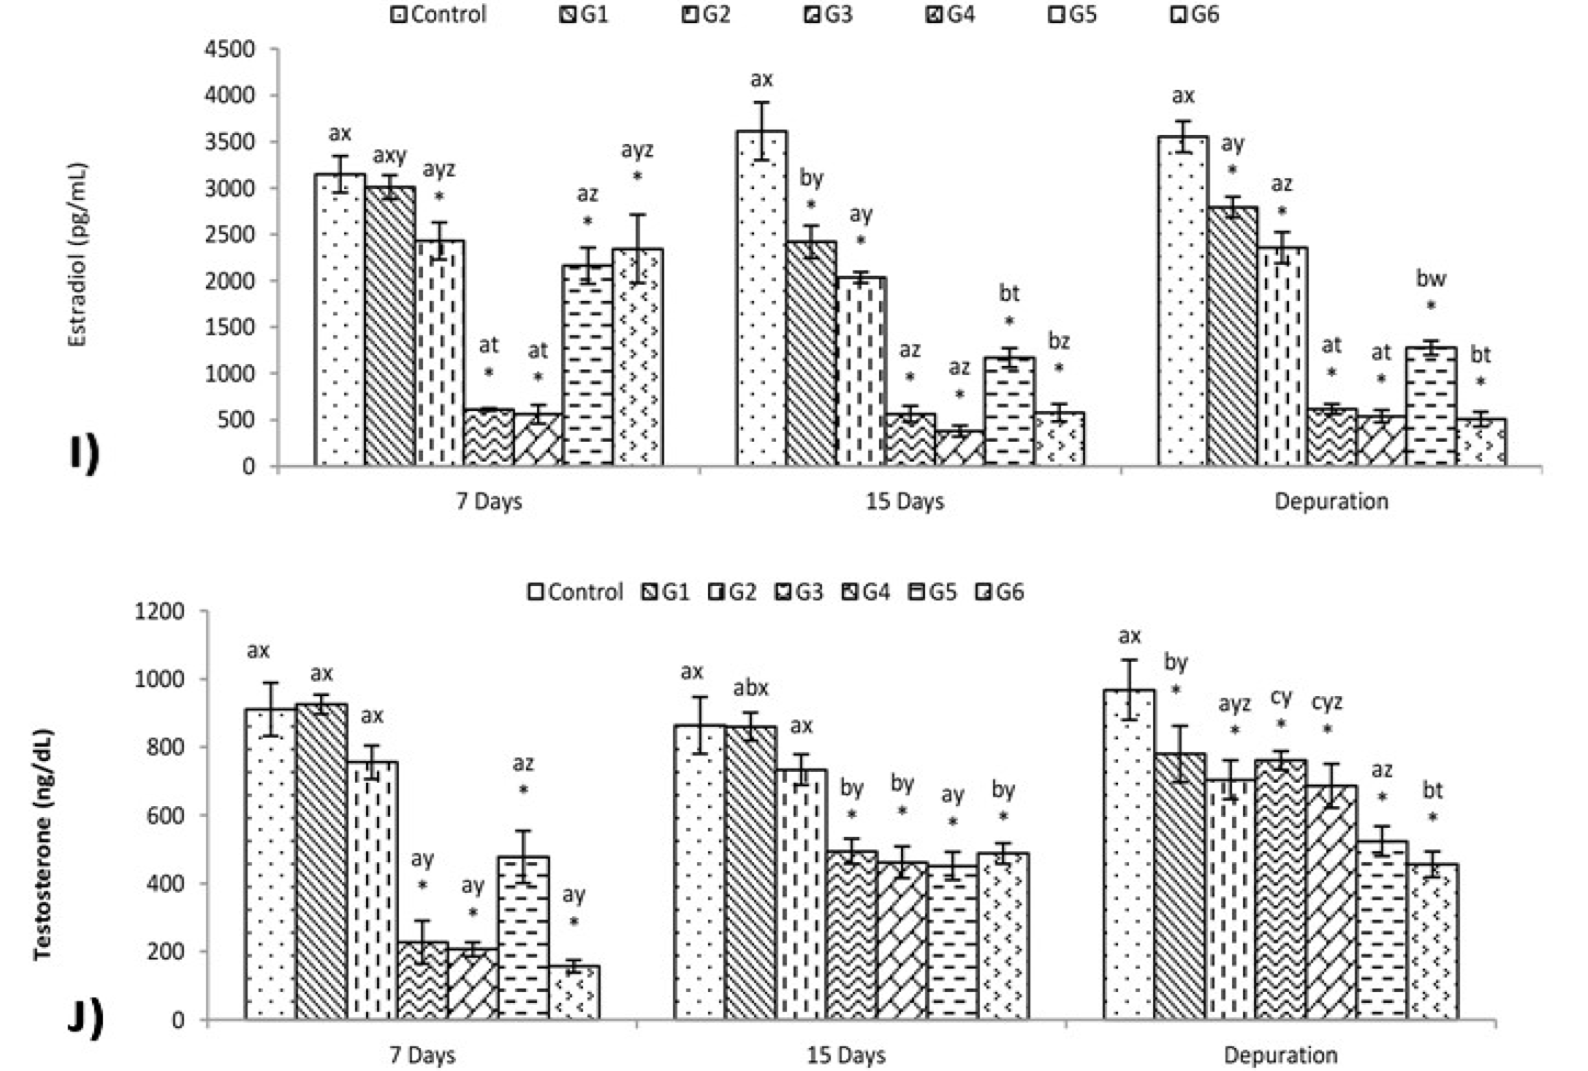
A) AChE (U/mg protein); B) EROD (nmol. min-1.mg protein-1); C) SOD (U/mg protein); D) CAT (U/mg protein); E) GST (U/mg protein); F) GSH (μM/ protein); G) MDA (nmol/mg protein); H) PCO (nmol carbonyl/mg protein); I) estradiol (pmol/L) and J) testosterone (ng/dL) measured in O. niloticus exposed to hiamethoxam; λ cyhalothrin and their combined treatments on 7th, 15th days and depuration period. Values showen are means ± standard error. * groups with parameters significantly different from control. The letters of a-c show significant differences between periods and letters of x-w show indicate significant differences amoung exposure groups for same period (n=6, p<0.05). (G1:23.86 mg/L thiamethoxam, G2: 47.72 mg/L thiamethoxam, G3: 0.145 μg/L λ cyhalothrin, G4:0.290 μg/L λ cyhalothrin, G5: 23.86 mg/L thiamethoxam+0.145 μg/L λ cyhalothrin, G6: 47.72 mg/L thiamethoxam 0.290+ μg/L λ cyhalothrin).