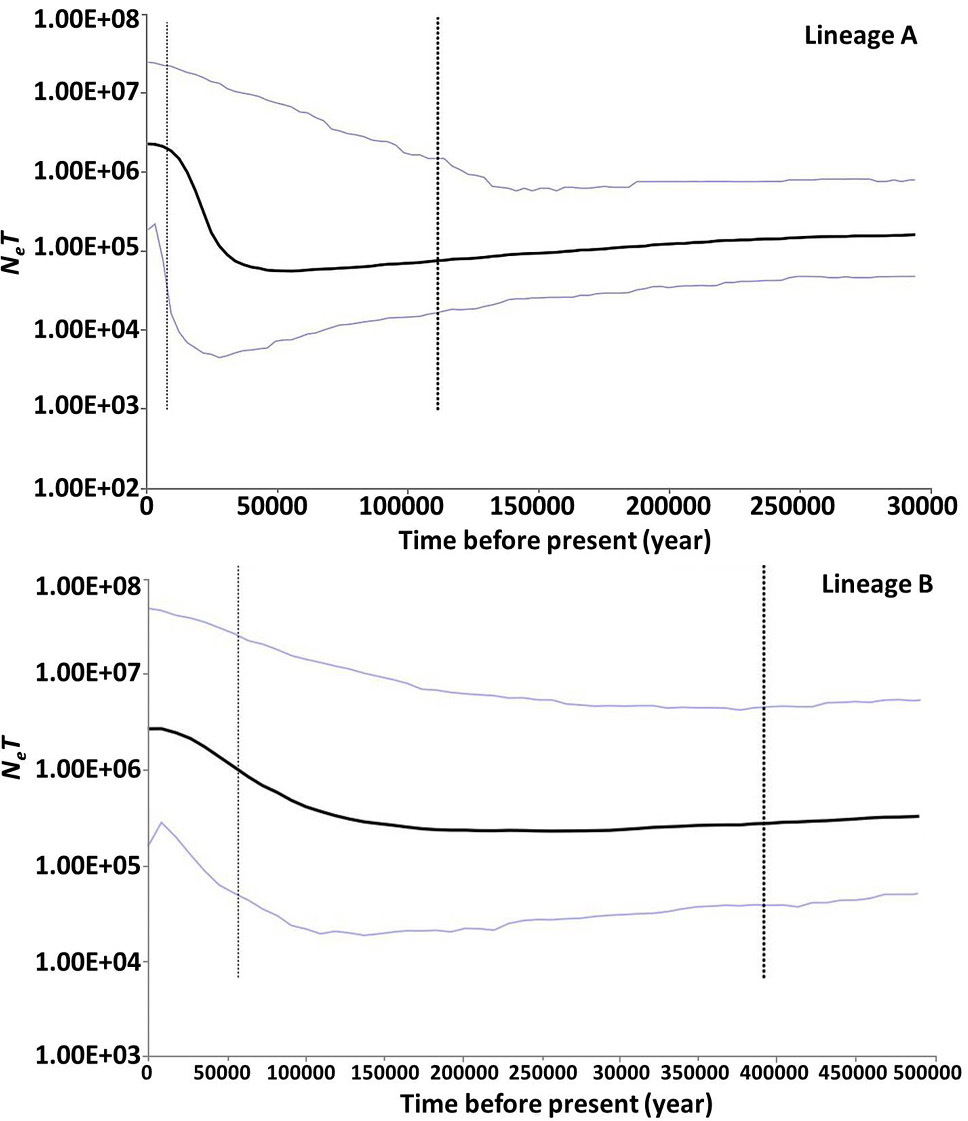
Fig. 5.
Bayesian skyline plots showing NefT (Nef, effective population size; T, generation time) changes over time for P. minor based on Cytb sequences. The upper and lower limits of the blue line represent the 95% confidence intervals of highest posterior densities (HPD) analysis. The black line represents median estimates of NefT.