View larger version:
Download Original File
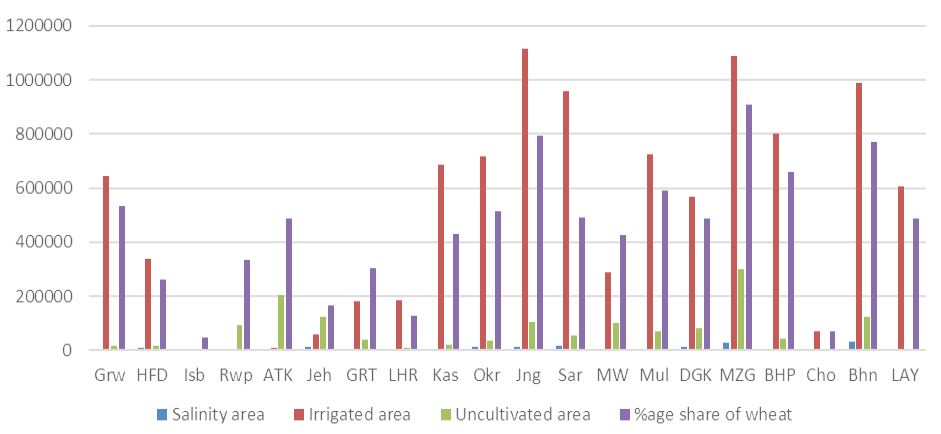
Figure 4:
District wise distribution of salinity in relation to uncultivated area, irrigated areaand wheat share during 2000.
