
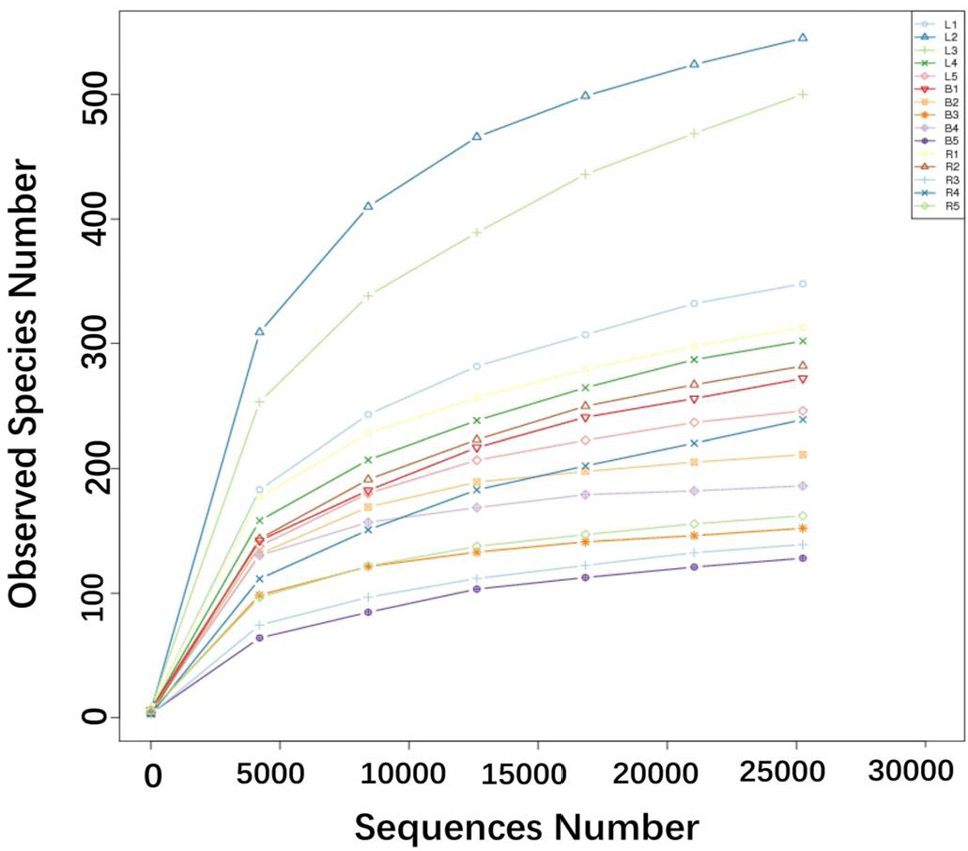
Fig. 4.
Rarefaction curves of the observed species indices for each sample. The x-coordinate represents the number of sequencing bars randomly extracted from one sample, and the y-coordinate represents the number of OTU constructed based on the sequences number, to reflect the sequencing depth. Different samples are represented by different color curves. Using a rarefaction depth of 25,252 sequences per sample, the number of OTUs have almost approached a plateau except two samples from the laying group, meaning the rationality of sequencing data.