
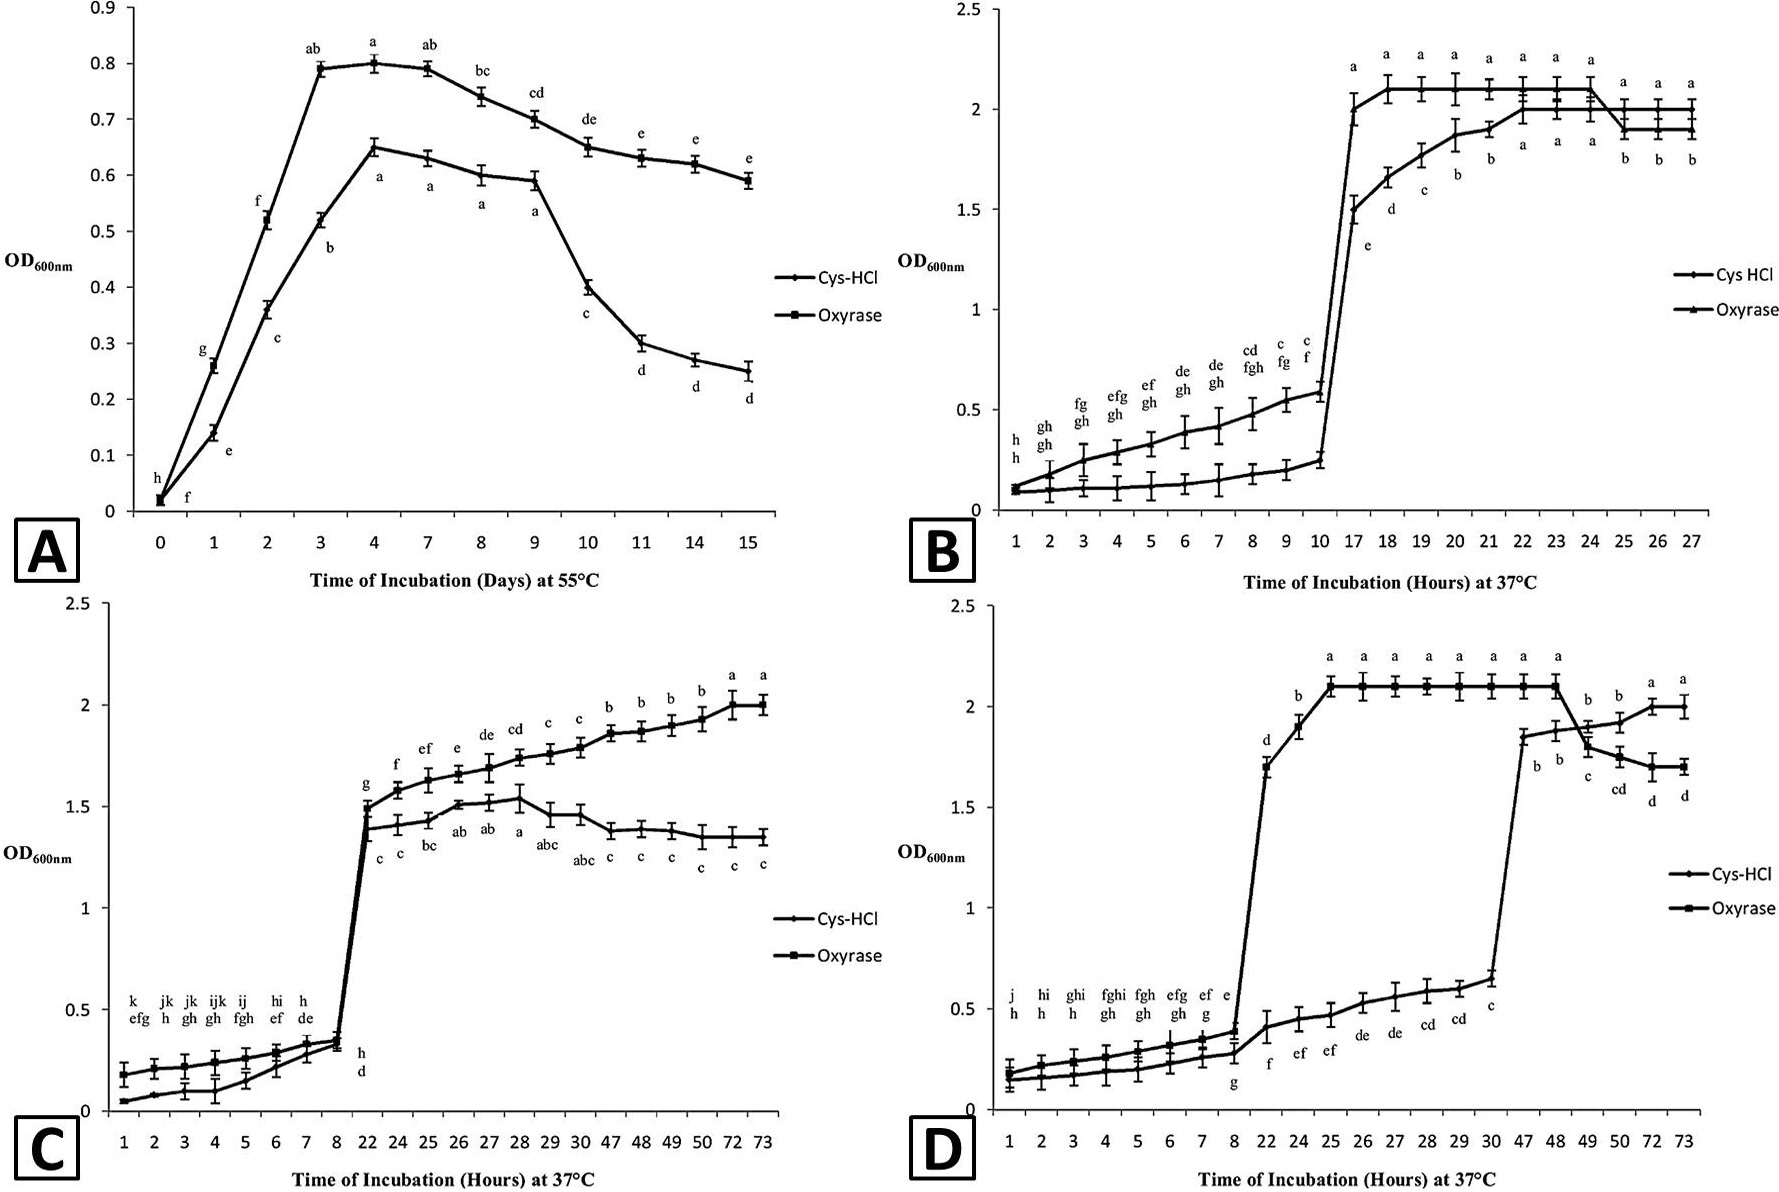
Fig. 4.
Comparison and effect of Cys-HCl and E. coli oxyrase on growth pattern of Anaerobaculum hydrogeniformans OS1 (A), Akkermansia muciniphila (B), Bilophila wadsworthia (C) and Roseburia intestinalis (D). Y-error bars represents the standard deviation among the triplicates. Each value is an average of three replicates, data labels followed by different letters differs significantly at ∝=0.05.