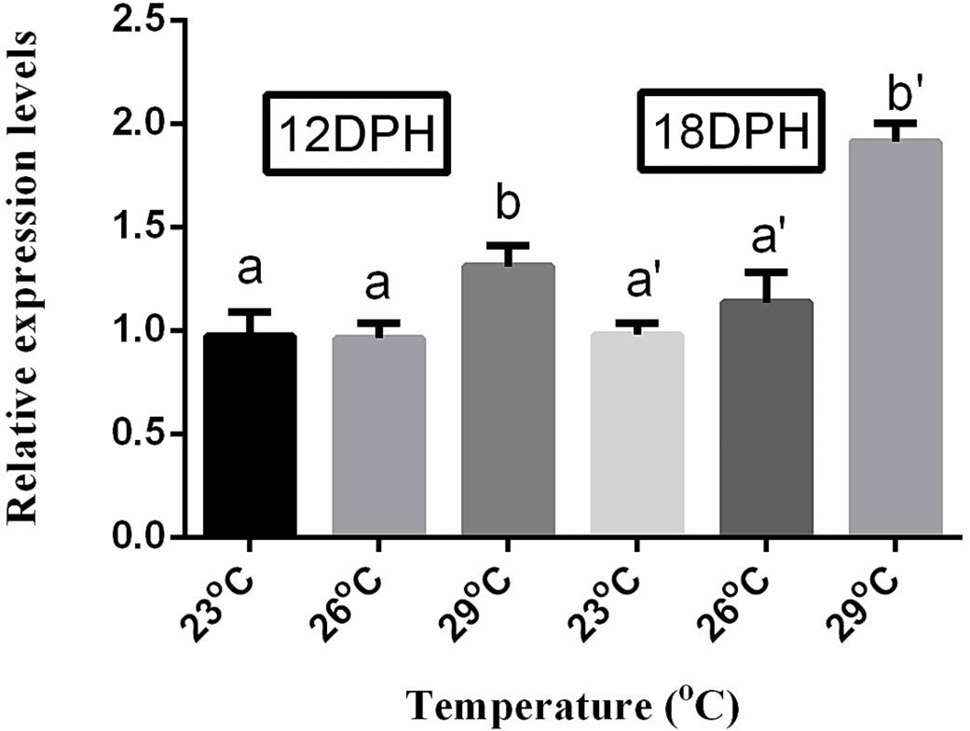
Fig. 7.
T. ovatus larvae was treated in 23°C, 26°C and 29°C, respectively. The left side of 12DPH represents the experimental T. ovatus larvae was on 12 days post hatching, the right side of 18DPH represents the experimental T. ovatus larvae was on 18 days post hatching. Each Bar represent the mean ± SD (n=3). Different lowercase letters indicate statistically significant differences (P<0.05).