
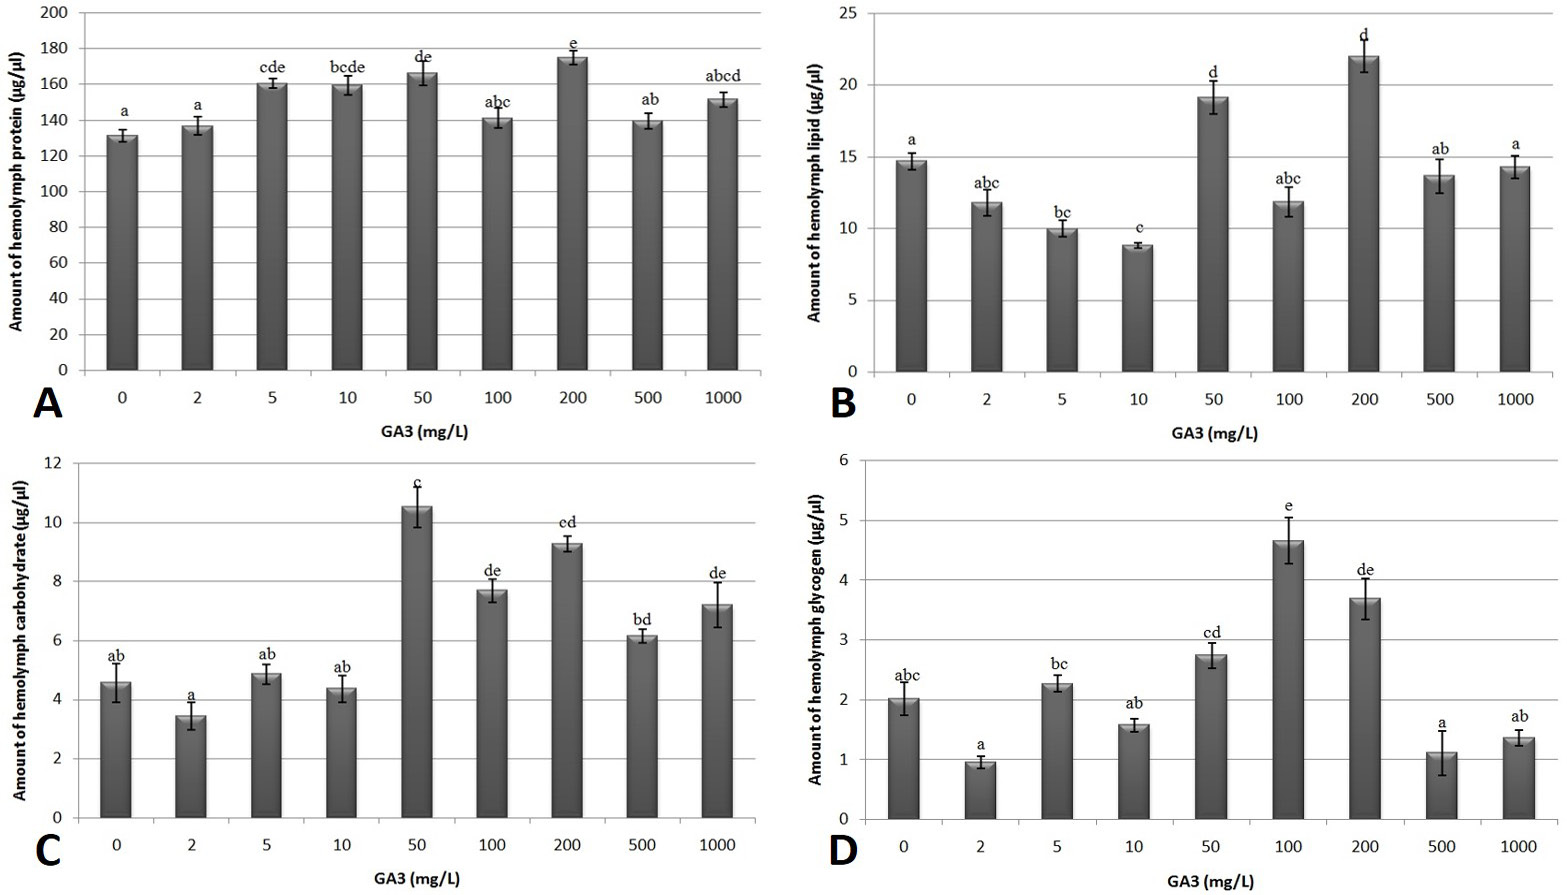
Fig. 1.
Effects of different GA3 concentrations on the hemolymph protein (A), lipid (B), carbohydrate (C) and glycogen (D) levels of Galleria mellonella. Means and standard errors given, letters denote significant difference based on Tukey-HSD test (P≤0.05).