
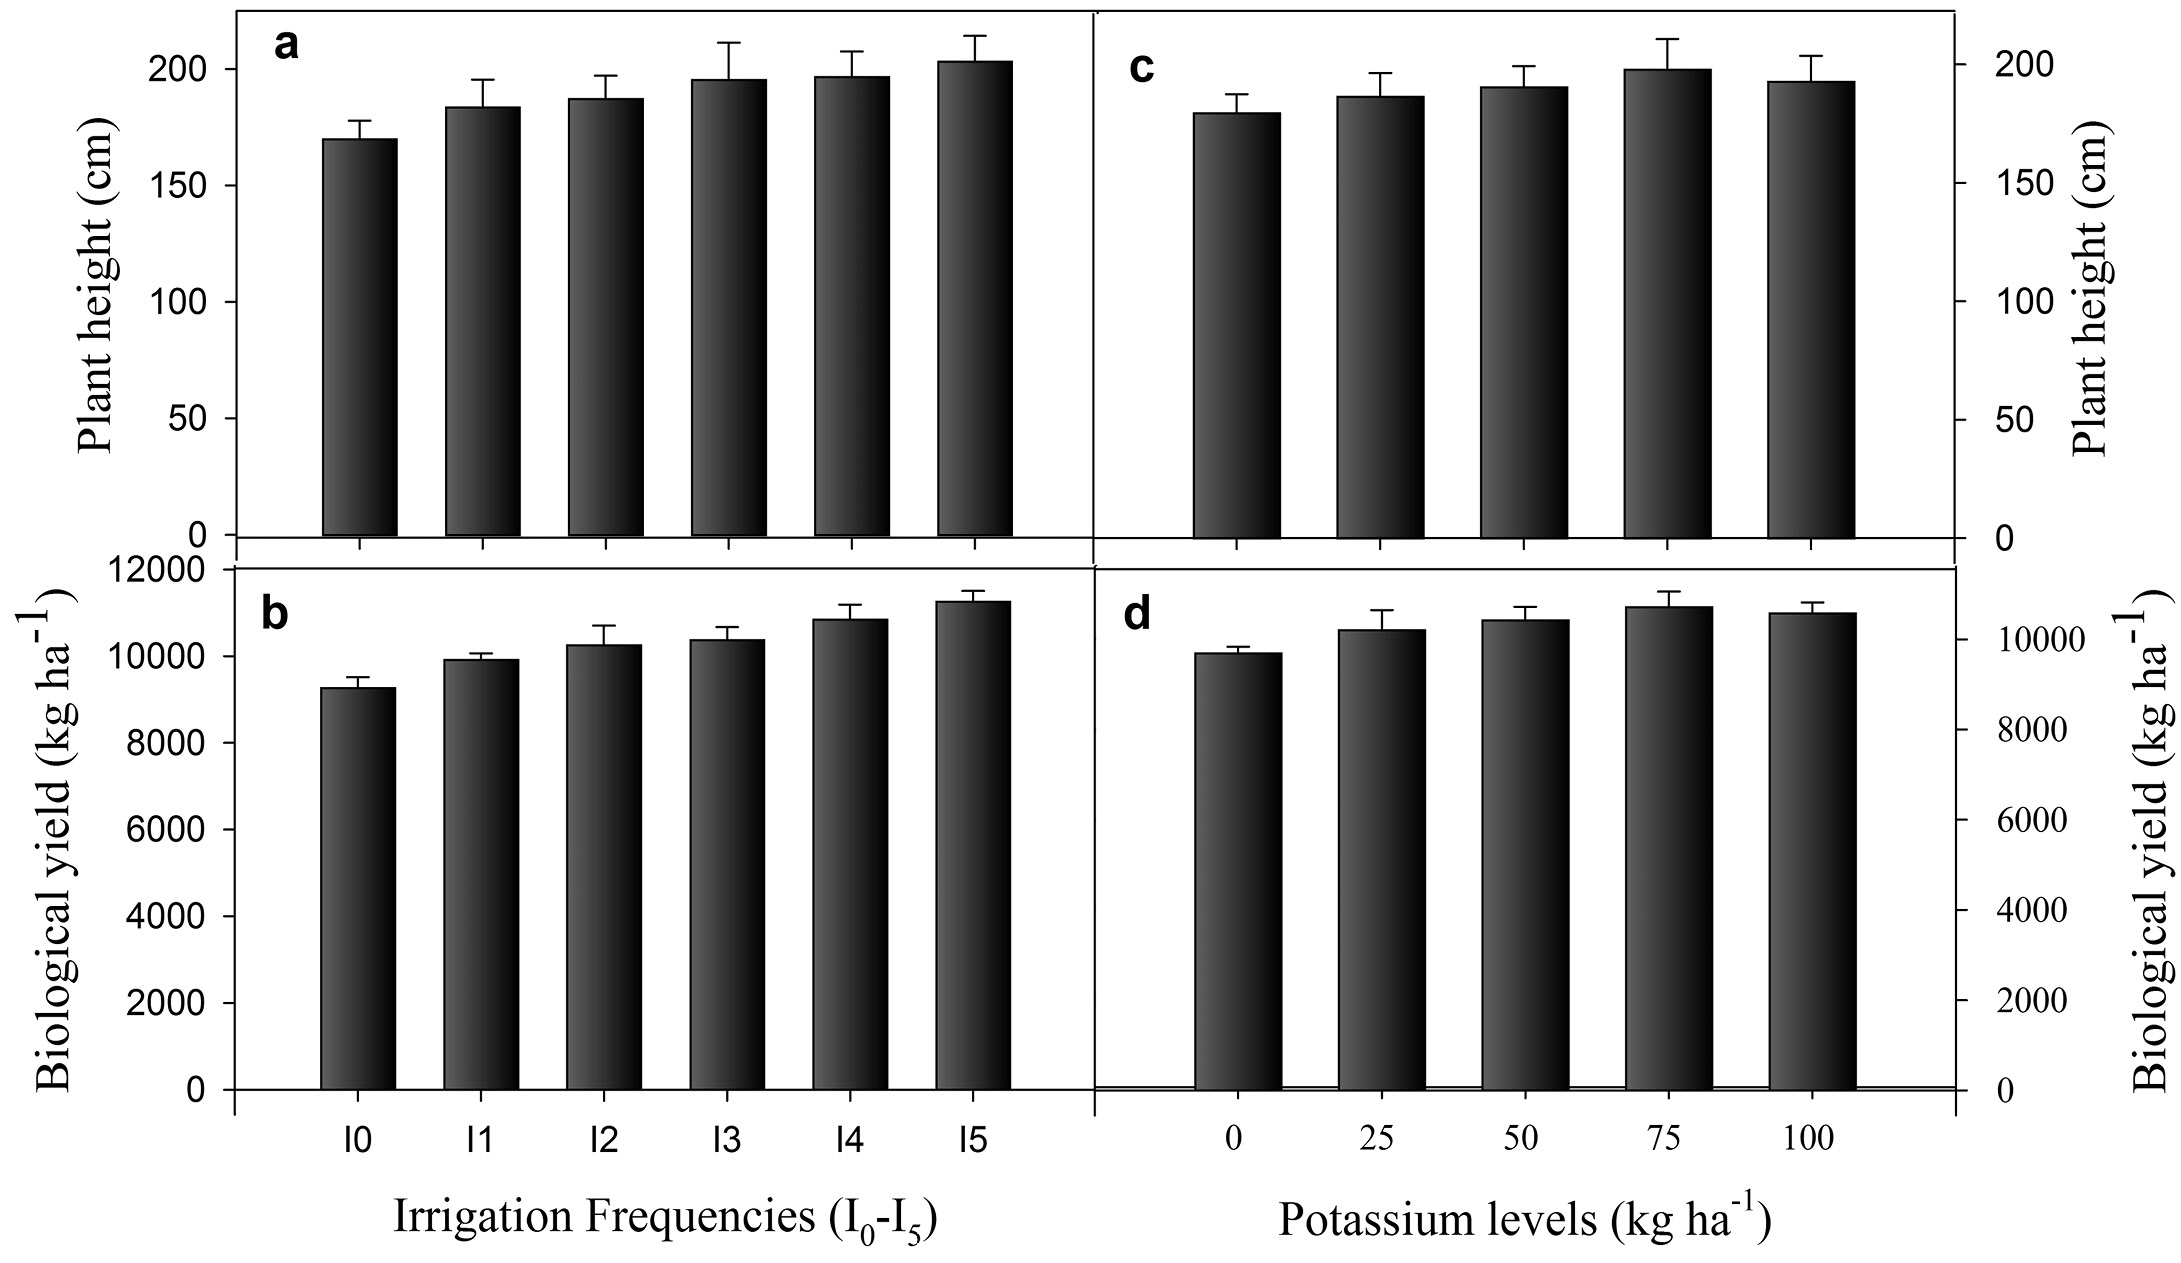
Figure 2
Plant height and biological yield of maize as affected by irrigation frequencies and K fertilization. Data presented in each bar are the means of three replicates while Error bars are standard errors of replicated data. I0 (zero or control irrigation), I1 (irrigation at V1 stage), I2 (two irrigations; each at V1 and V7 stage), I3 (three irrigations; each at V1, V7 and VT stage), I4 (four irrigations; each at V1, V7, RT and R2 stage) and I5 (five irrigations; each at V1, V7, RT, R2 and R4 stage).