
Figure 2
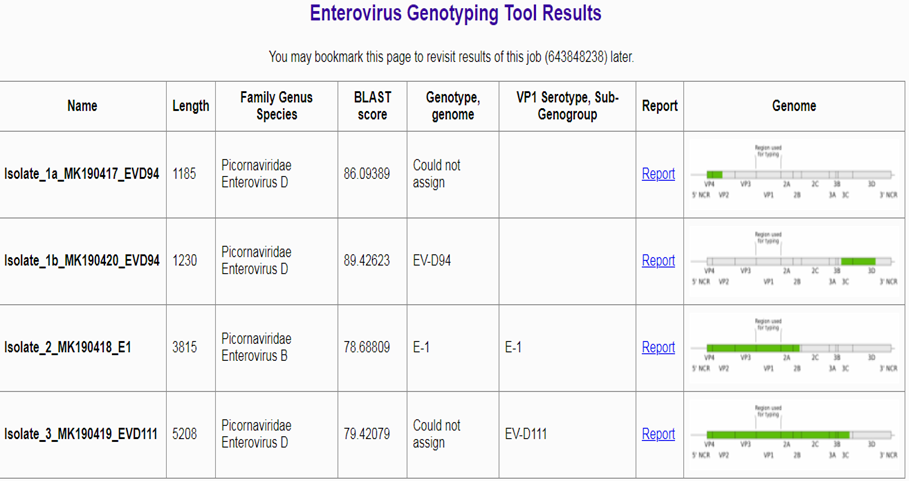
The Contigs assembled from the Illumina sequencing data generated for the three PE-5UTR positive isolates. The contigs and the genomic regions covered are displayed using the EGT.
The Contigs assembled from the Illumina sequencing data generated for the three PE-5UTR positive isolates. The contigs and the genomic regions covered are displayed using the EGT.