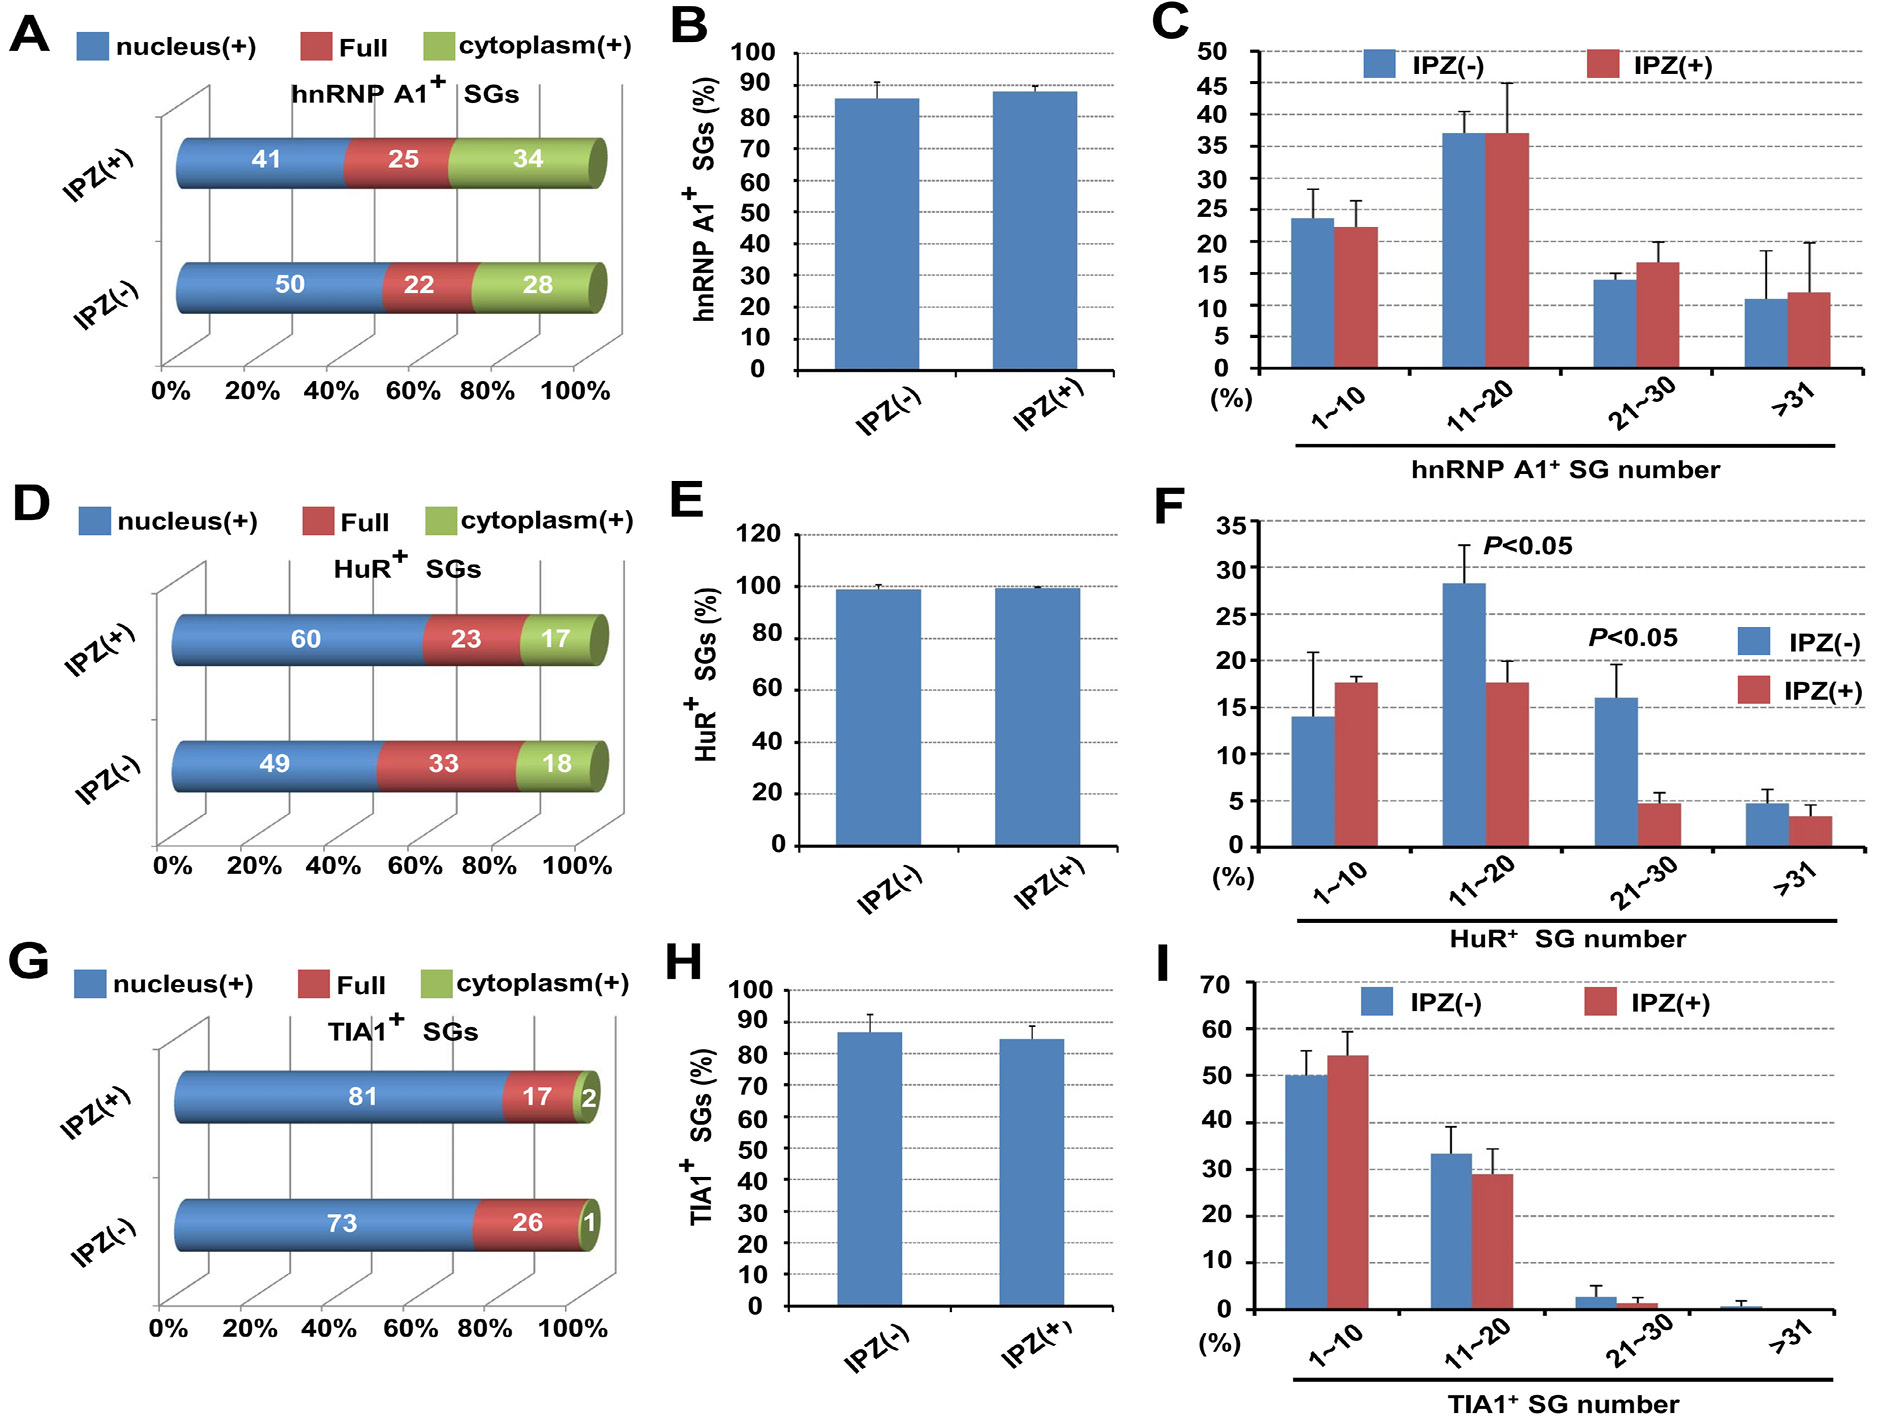
Fig. 4.
Quantification analysis for the effect of IPZ on the nucleus/cytoplasm localization, SG formation of hnRNP A1, HuR and TIA1 during arsenite-induced oxidative stress. The ratio of cells with the nucleus-localized signal, cytoplasm-localized signal, or full cell-localized signal of hnRNP A1 (A), HuR (D), and TIA1 (G) in all selected cells was calculated, respectivly. The percentage of hnRNP A1 (B), HuR (E), TIA1 (H) marked SG positive cells, and numbers of hnRNP A1 (C), HuR (F), TIA1 (I) marked granules per cell were also measured. Based on SG number per cell, there are four categories, namely 1~10, 11~20, 21~30 and >30. An independent-sample Student’s T Test was performed using SPSS 16.0. P<0.05 means significant difference.