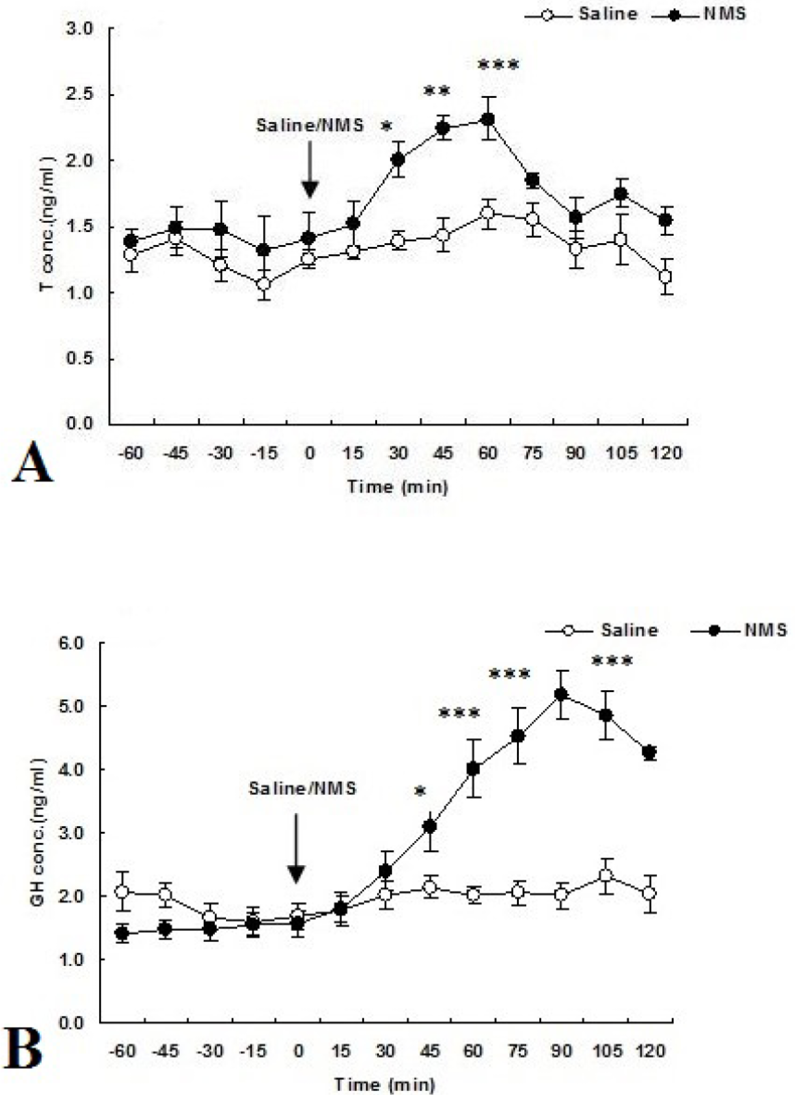
Fig. 3.
(A) Mean (±SEM) changes in plasma T levels (ng/ml) before and after saline/NMS administration (at 0 min) in normal fed adult male monkeys. (B) Mean (±SEM) changes in plasma GH levels (ng/ml) before and after saline/NMS administration (at 0 min) in normal fed adult male monkeys. *P<0.05, **P<0.01, ***P<0.001 vs 0 min (ANOVA followed by post hoc Dunnett’s test).