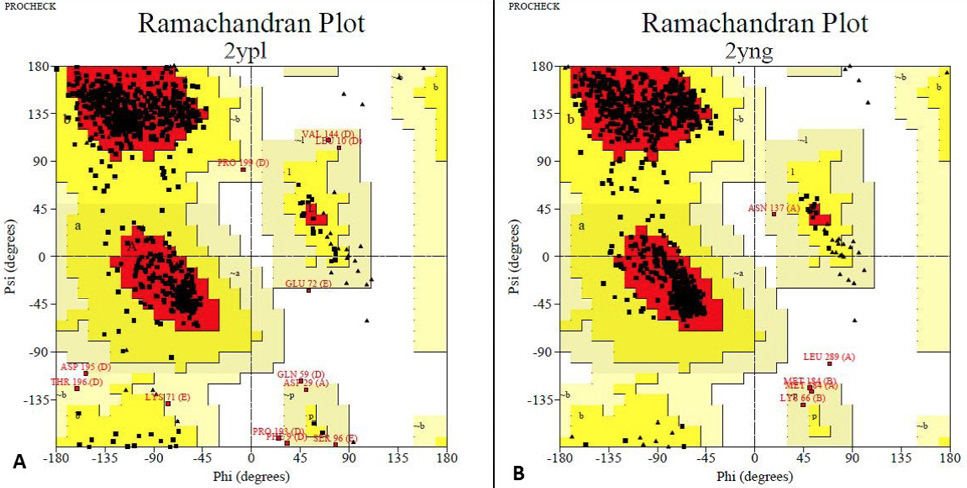
Fig. 4.
Rampage analysis: The Ramachandran plots show the phi (ϕ)-psi (ψ) torsion angles for every residue of a protein. A, The final model had 87.3% residues in the most favored regions, 11.3% in additional allowed regions. Total number of residues were 821. B, The final model had 92.5% residues in the most favored regions, 6.9 % in additional allowed regions. Total number of residues were 971. Based on an analysis of 118 structures of resolution of at least 2.0 Angstroms and R-factor no greater than 20%, a good quality model would be expected to have over 90% in the most favoured regions.