
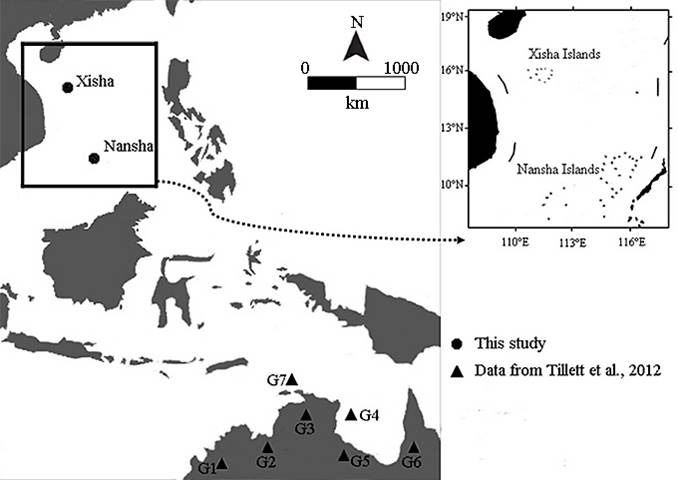
Fig. 1.
Sampling localities for this study. Triangles represent populations from Tillett et al. (2012). G1, Mitchell River, Robison River and Fitzroy River; G2, Daly River and Ord River; G3, East Alliagator River; G4, Blue Mud Bay; G5, Roper River, Towns River, Limmen River and Robinson River; G6, Wenlock River, Mission River and Mitchell River; G7, Tiwi Islands. Circles represent locations sampled in this study (Xisha and Nansha Islands).