View larger version:
Download Original File
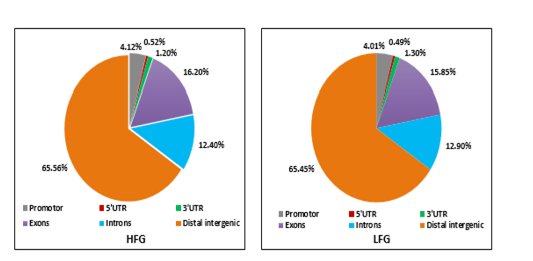
Figure 2
Pie charts of the distribution ratios of CGI in both high and fertility groups