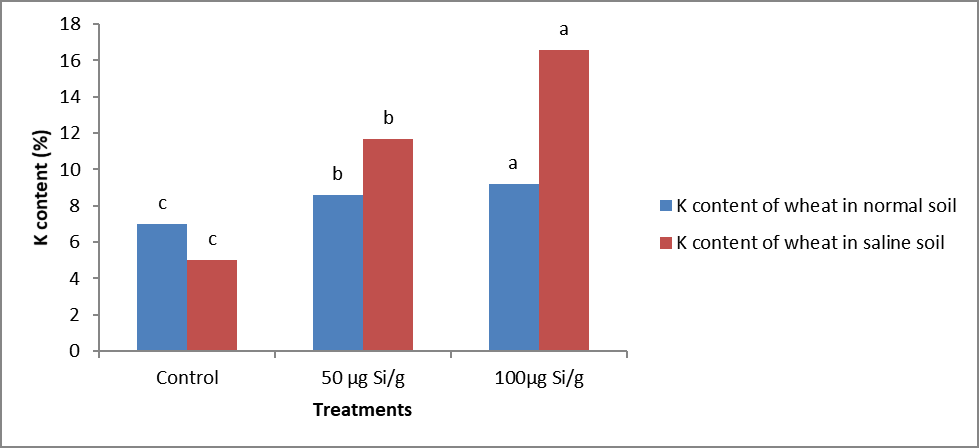
Impact of various silicon concentrations on K content of wheat shoot (%) under normal and salt affected soils.