
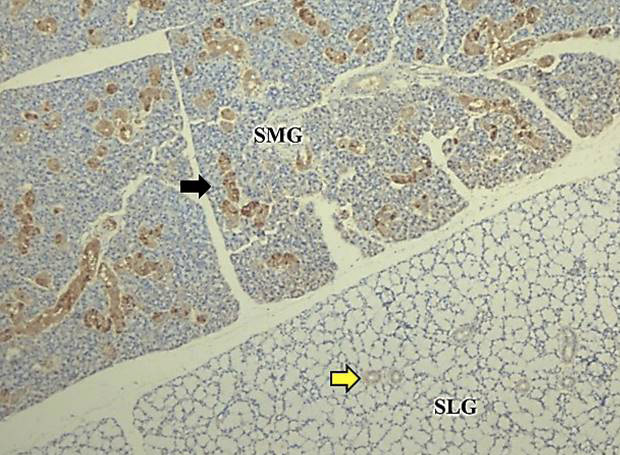
Fig. 3.
Comparison of expression of TGF-α between SMG and SLG of group A2: Immunohistochemically stained section of SMG and SLG showing a highly positive staining (4+) of TGF-α in the ducts of SMG (black arrow) while the ducts of SLG (yellow arrow) are stained minimally (1+) with TGF-α suggesting that TGF-α is highly expressed in SMG as compared to SLG at week 9.