
Fig 4
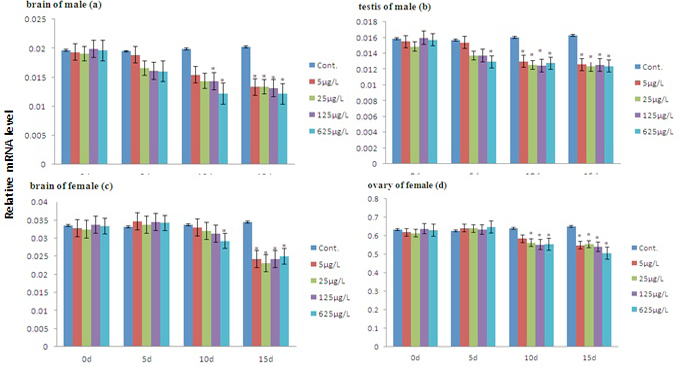
The expression of Foxl2 in the brain and gonads of juvenile carp treated with 0, 5, 25, 125, 625μg/L letrozole for 15 d. Data are presented as means ± S.E. (n=5) and normalized against the mRNA expression of β-actin. The asterisk symbols denote significant differences compared with the control group: *p< 0.05 and **p< 0.01.