
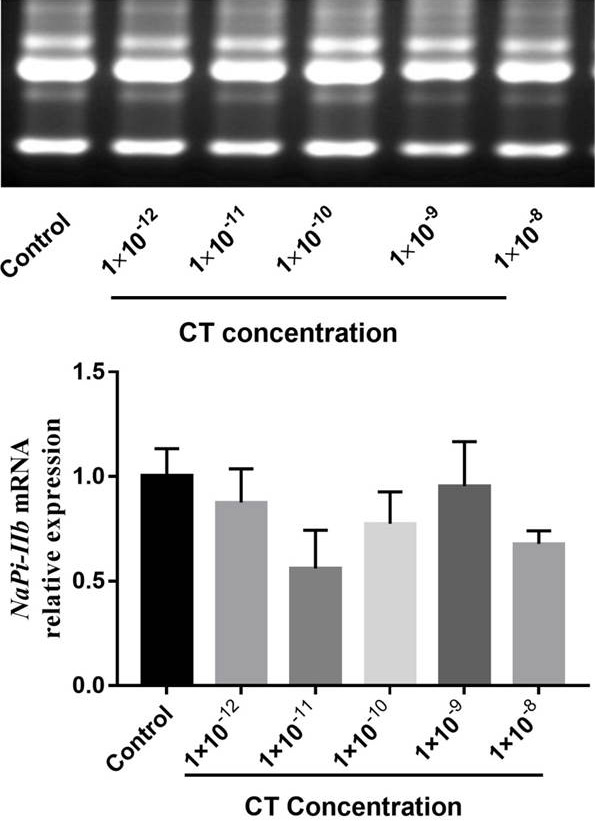
Fig. 4.
Effects of CT treatment on expression of NaPi-IIb gene. Data are means±SD, n=6. Bars without letter means no significant difference (P > 0.05).
Effects of CT treatment on expression of NaPi-IIb gene. Data are means±SD, n=6. Bars without letter means no significant difference (P > 0.05).