
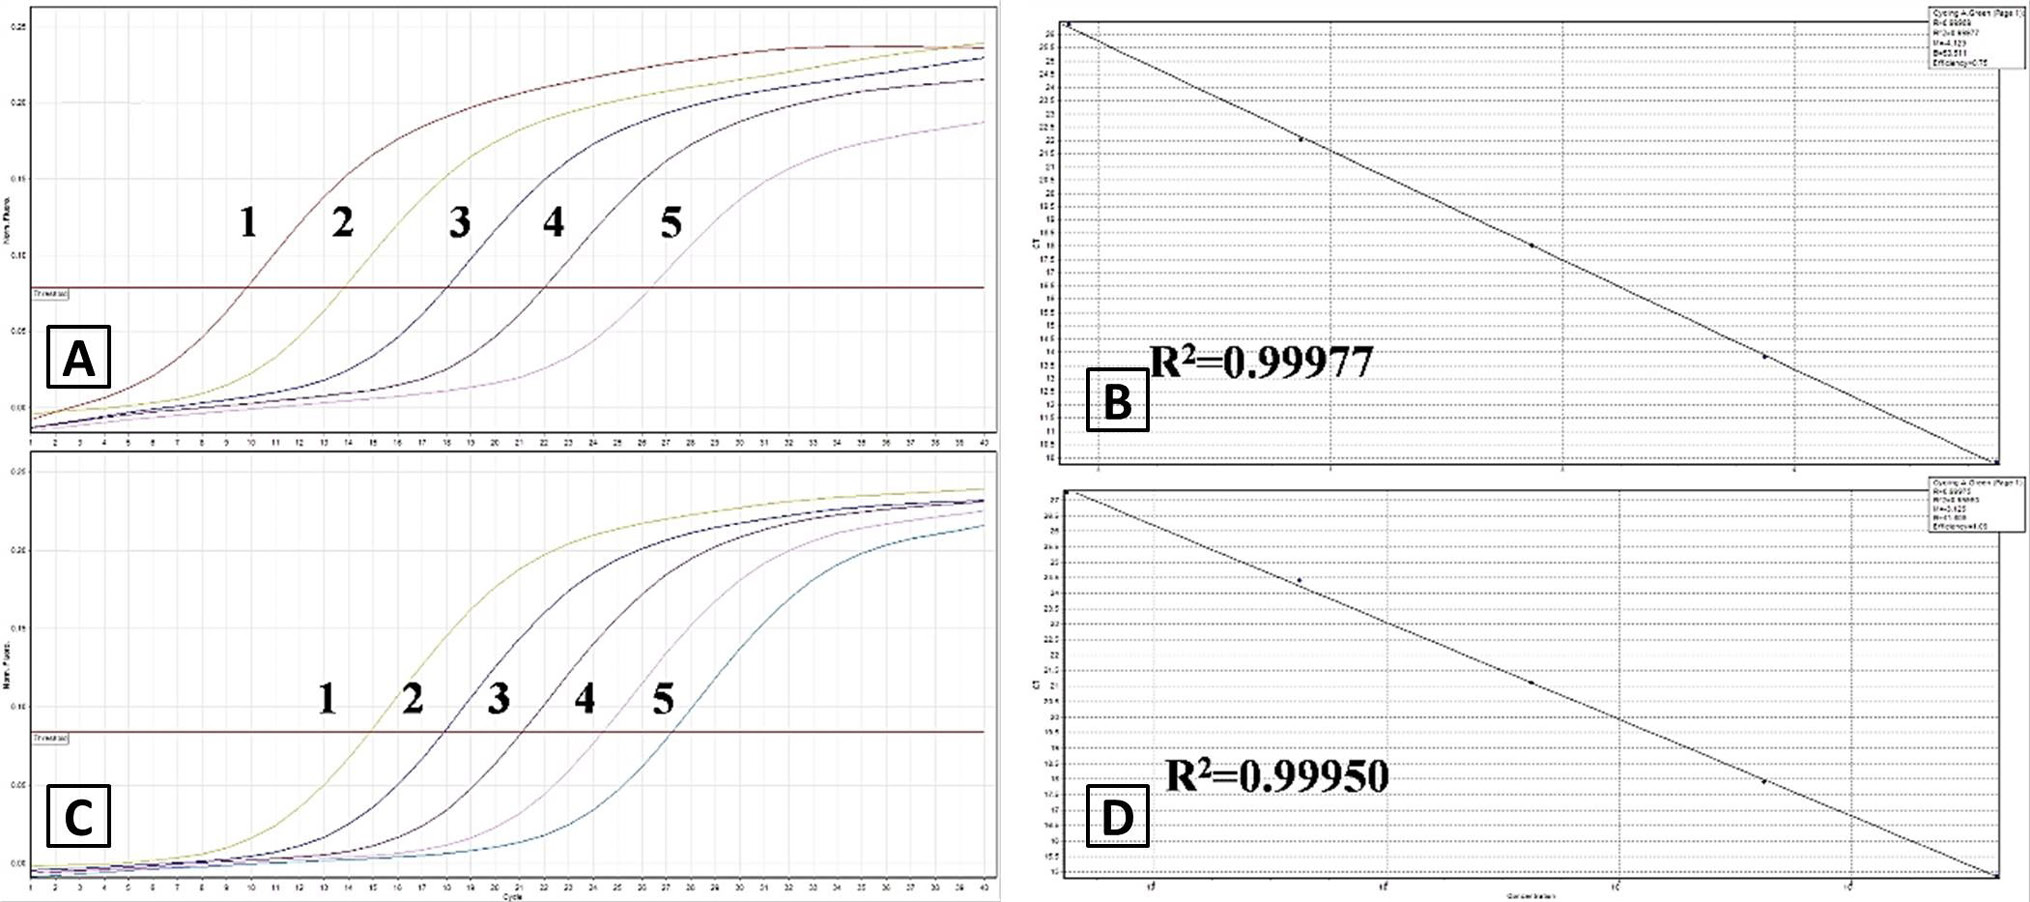
Fig. 1.
Amplification curves (A, CPV; C, CDV) and standard curves (B, CPV; D, CDV) for CPV and CDV. Ten-fold serial dilutions of the CPV plasmid standard and the CDV plasmid standard were used for amplification, as indicated on the X-axis, and the corresponding cycle threshold (CT) values are presented on the Y-axis. A: 1–5: Equal dilutions of the CPV plasmid 10-1–10-5; C: 1-5: equal dilutions of the CDV plasmid 10-1–10-5.