View larger version:
Download Original File
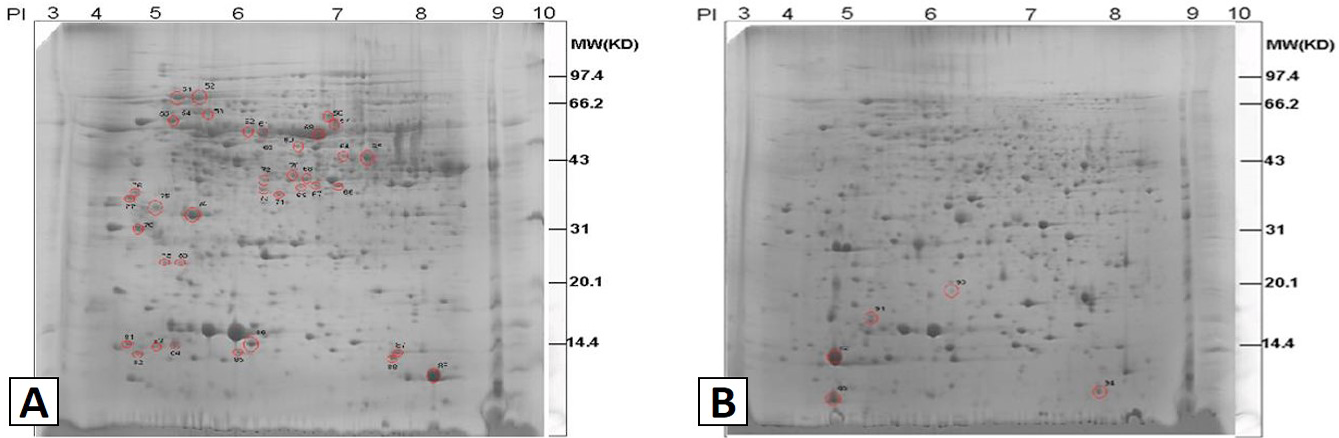
Fig. 3.
2-DE specific expression protein spots: A, inoculated group; B, control group.