
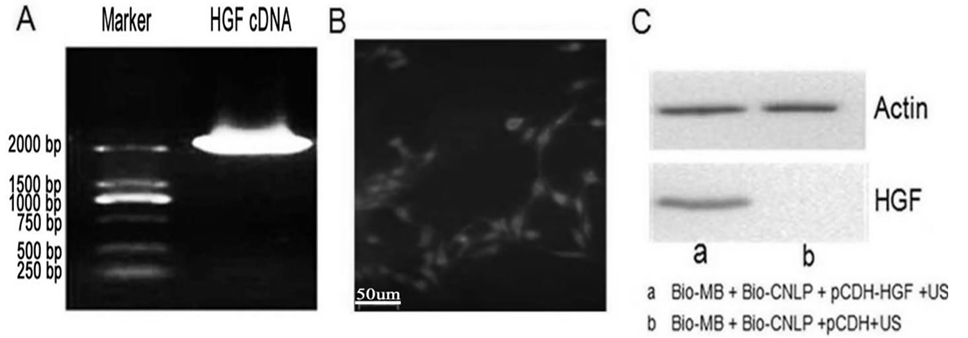
Fig. 1.
The construction of HGF expression vector and preparation of Bio-MB+Bio-CNLP. The HGF cDNAs were generated by PCR amplification and the expected ~2200 bp bands are shown (A), After transfection, the HGF expression was examined (B), in HSC-T6 by IF-IC andin L02 by Western blot (C). As a negative control, L02 cells transfected with blank pCDH vector had no detectable HGF bands.