
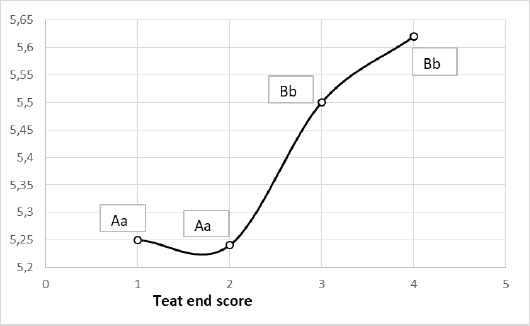
Figure 2:
Evolution of somatic cell count (Log10SCC) according to teat end hyperkeratosis score (A,B: different letter shows significant differences between the groups for P<0.01, a,b: different letter shows significant differences between the groups for P<0.05).