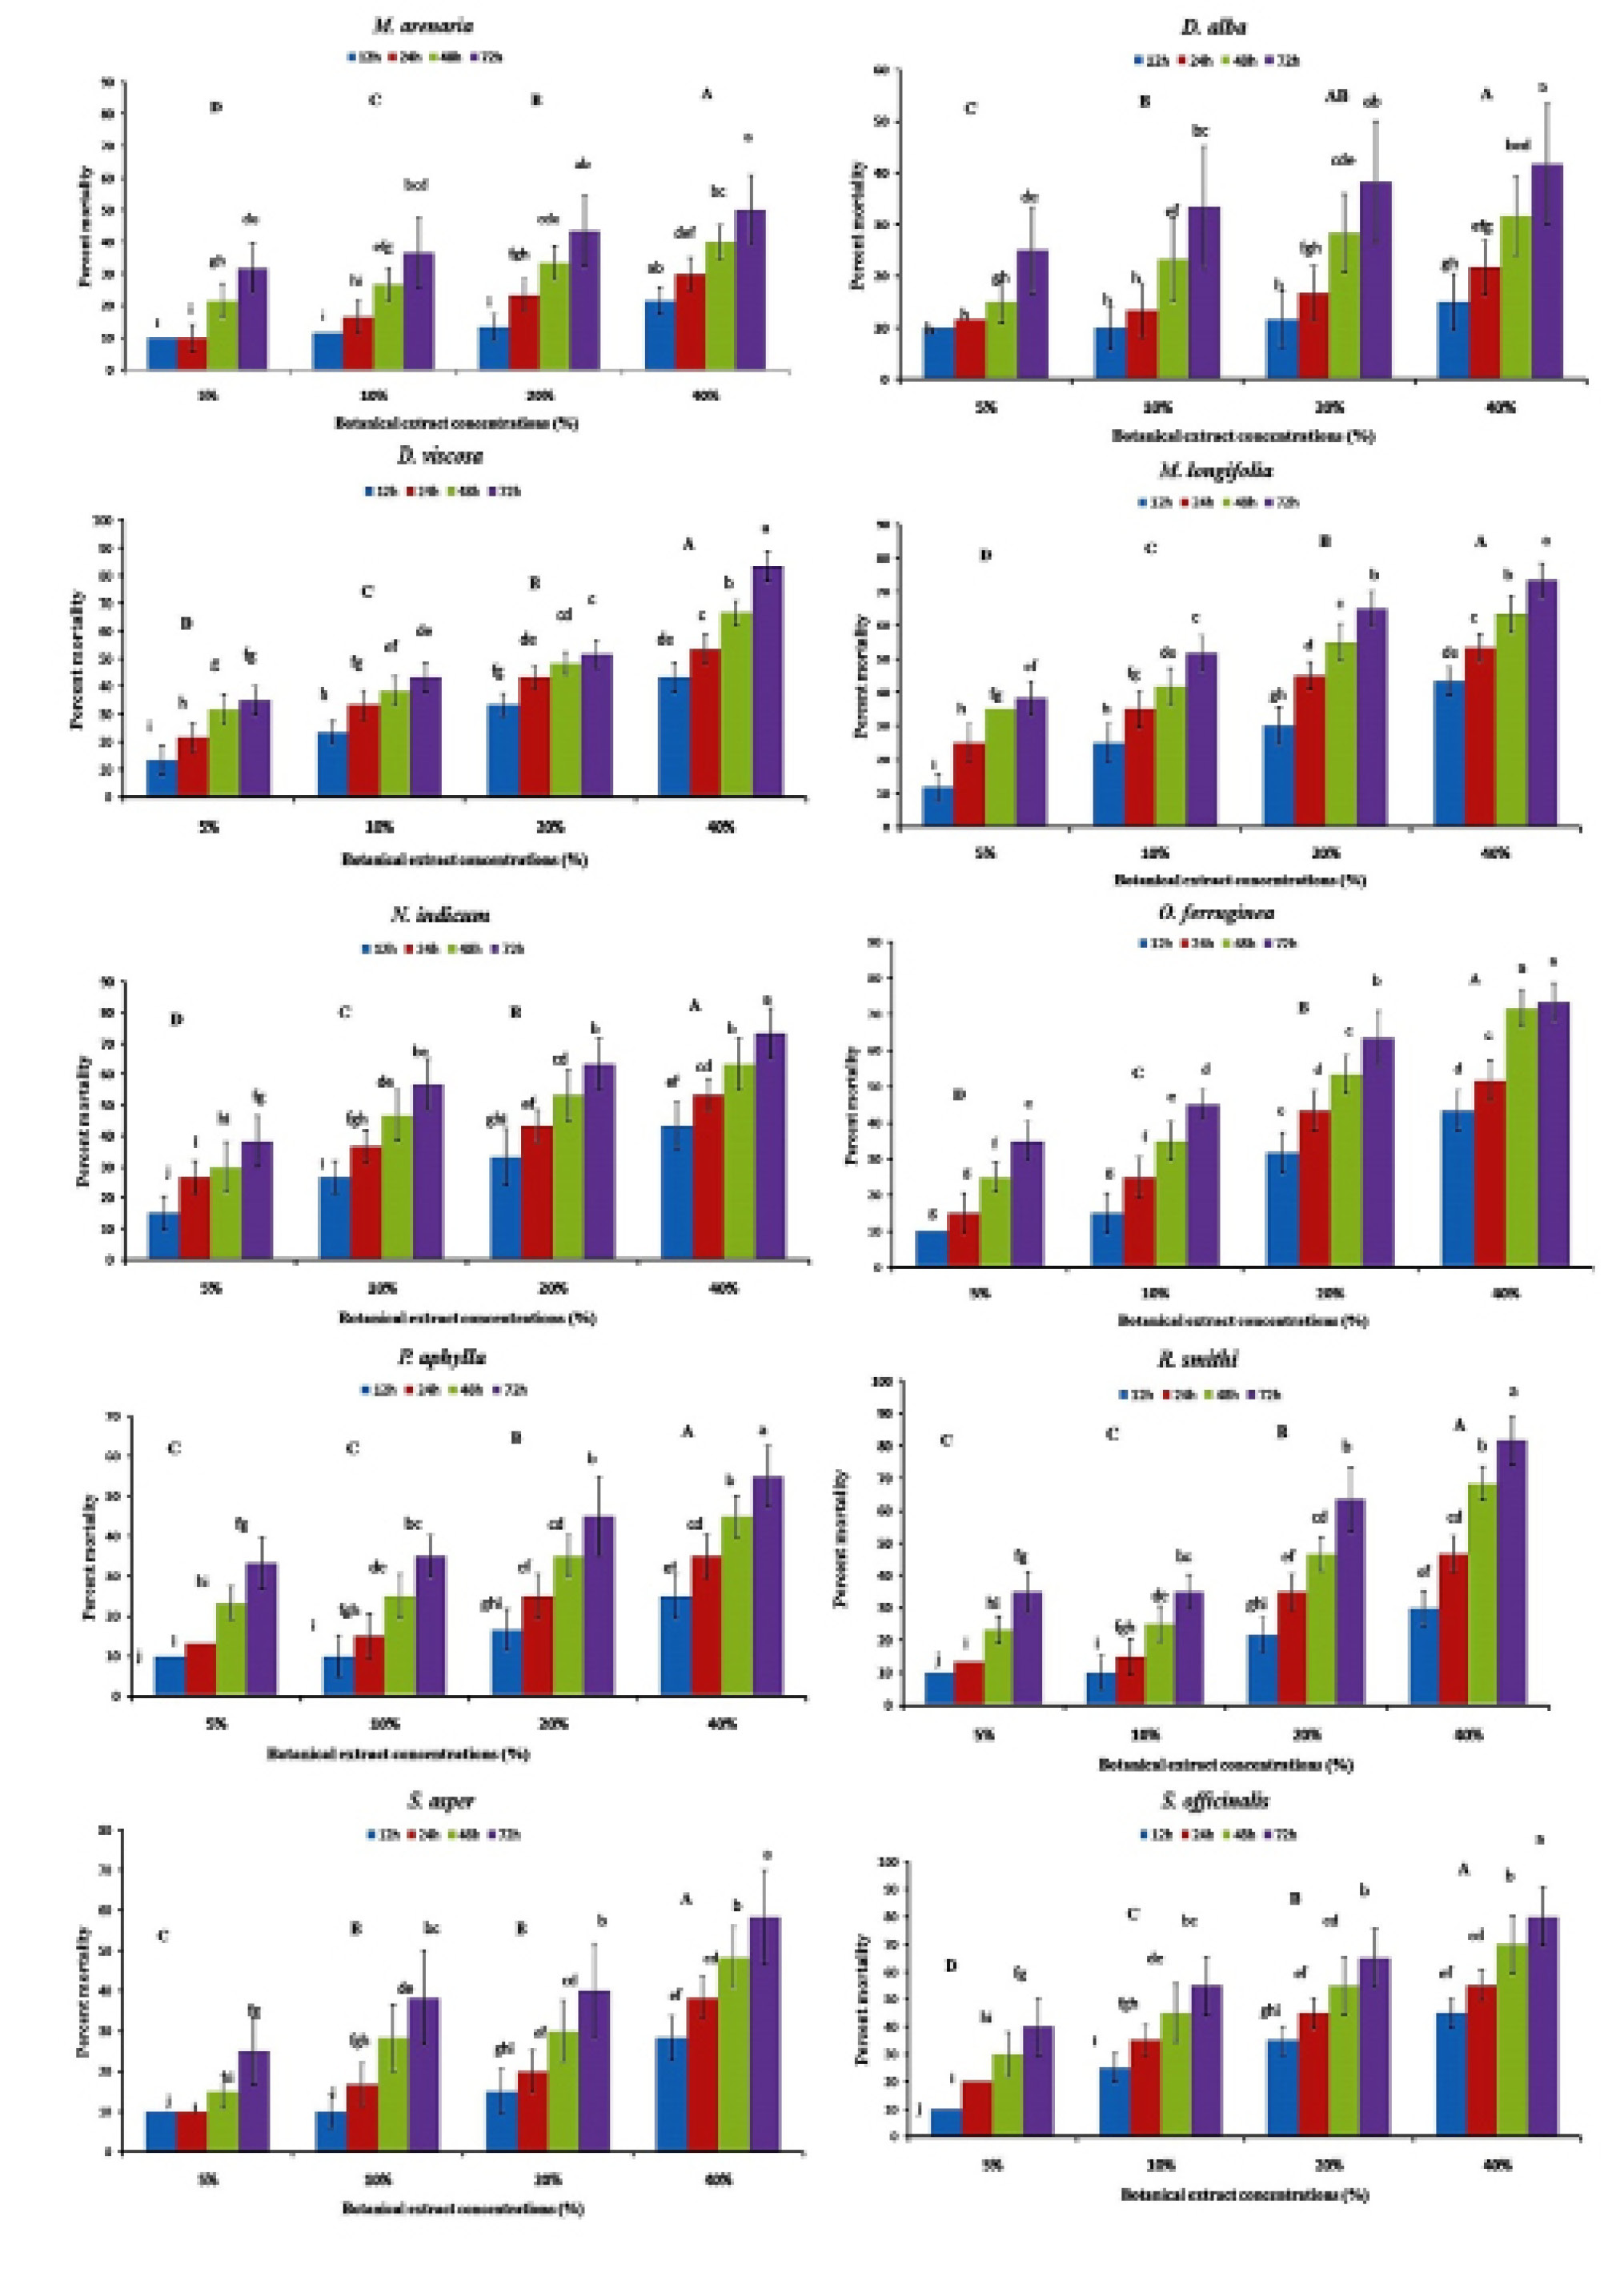
Figure 3:
Percent mortality (mean ± SE; n = 10) of cotton aphid (A. gossypii) individuals exposed to different concentrations of botanical extracts observed at different post-exposure time intervals. For each botanical extract, small alphabets indicate statistical difference among time intervals for each concentration, while capital alphabets are indicating the statistical difference among different concentrations (one-way factorial ANOVA; HSD at α = 0.05).