
Fig. 4.
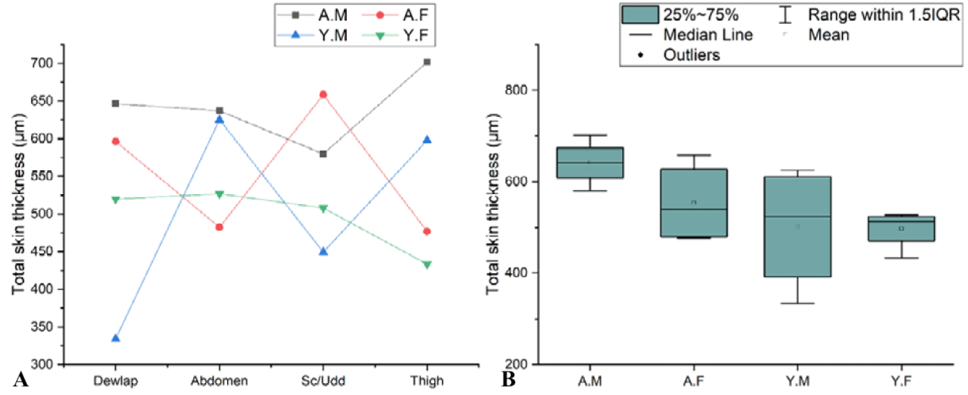
Thickness (µm) of Total skin layer of red Sindhi cattle. A, Comparative curve lines among adult and young genders from dewlap to thigh regions. B, Box plot showing the pattern of quantitative data of adult and young genders.
Thickness (µm) of Total skin layer of red Sindhi cattle. A, Comparative curve lines among adult and young genders from dewlap to thigh regions. B, Box plot showing the pattern of quantitative data of adult and young genders.