Figure 3
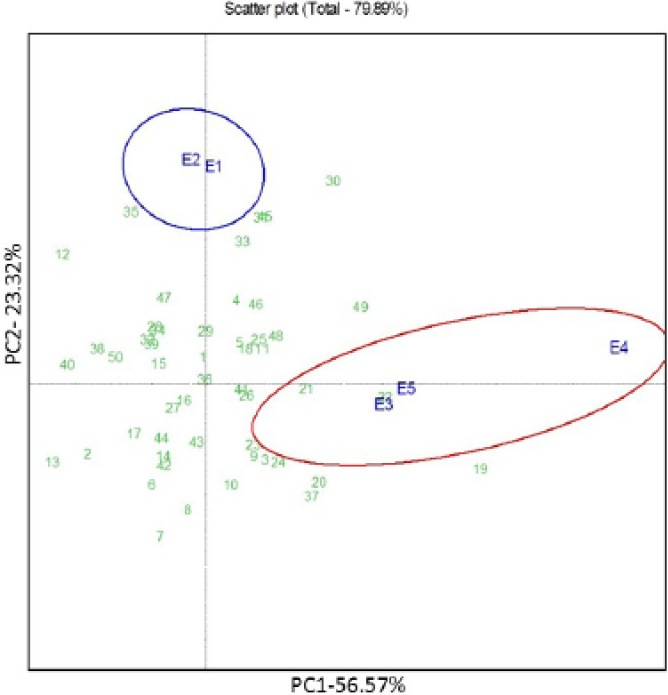
GGE biplot showing mega-environment based on mean yield of 50 wheat genotypes evaluated across five environments, 2011/12 and 2012/13. The oval and circles represent mega-environments
GGE biplot showing mega-environment based on mean yield of 50 wheat genotypes evaluated across five environments, 2011/12 and 2012/13. The oval and circles represent mega-environments