
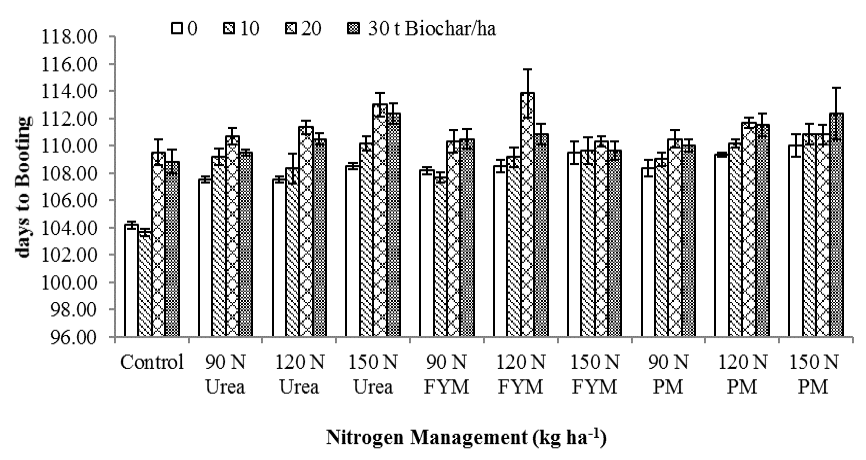
Figure 2:
BC × N interaction over years for days to boot stage of wheat. The small bars at the top of the big bars in (Fig. 2 to 8) represent the standard error.
BC × N interaction over years for days to boot stage of wheat. The small bars at the top of the big bars in (Fig. 2 to 8) represent the standard error.